APIs are essential for modern software, and monitoring them ensures performance,
reliability, and security. Sometimes you need monitoring tools to understand
API-specific metrics while other times you want to connect your API monitoring
to the rest of your infrastructure. Here are five API monitoring tools and three
general monitoring tools developers should know, each with unique features to
suit different needs:
**API Monitoring Tools**
- **[Moesif](https://www.moesif.com/features/api-monitoring)**: Combines API
monitoring with user behavior analytics. Great for teams focusing on user
experience and detailed API insights.
- **[Postman API Monitors](https://learning.postman.com/docs/monitoring-your-api/intro-monitors/)**:
A versatile tool for API testing, monitoring, and collaboration. Perfect for
integrating with CI/CD workflows.
- **[Runscope](https://www.runscope.com/)**: Simplifies API testing and
monitoring with automated tools and global performance tracking.
- **[API Context](https://apicontext.com/)**: Ensures continuous API performance
with advanced synthetic monitoring
- **[Treblle Observability](https://treblle.com/)**: Built-in insights as part
of Treblle’s API Intelligence platform, giving teams real-time visibility
across every API
**General Monitoring Tools**
- **[Sematext](https://sematext.com/)**: Offers unified monitoring across APIs,
logs, and infrastructure. Ideal for teams managing multiple systems.
- **[Datadog](https://www.datadoghq.com/)**: Provides full-stack monitoring,
linking API performance with infrastructure metrics for deep insights.
- **[SmartBear AlertSite](https://smartbear.com/product/alertsite/)**:
Enterprise synthetic monitoring of APIs and Web Apps with global coverage and
multi-step transaction tests.
### Quick Comparison
| Tool | Key Strength | Best For | Starting Price |
| ------------------- | ----------------------------------------------- | -------------------------------------------------- | --------------------------------- |
| Moesif | User behavior analytics | Product teams prioritizing UX | Pay-as-you-go |
| Postman | Seamless integration with the Postman ecosystem | Development teams already using Postman | Free tier available |
| Runscope | Simplified monitoring | Medium-sized teams | $79/month |
| API Context | Observability focus | Teams needing immediate feedback loop on live APIs | $29/month |
| Treblle | Real-time Monitoring and debugging | Small teams and Startups | Free tier available |
| Sematext | Broad monitoring scope | Teams managing multiple systems | $49/month |
| Datadog | Full-stack system insights | Enterprise-level operations | $15/host/month |
| Smartbear Alertsite | End-to-end Transaction monitoring | Unified UI and API Performance | Likely Expensive - Pricing hidden |
Choose the tool that aligns with your team's needs to keep APIs secure,
efficient, and reliable.
## 1\. Moesif: Advanced API Monitoring and Analytics
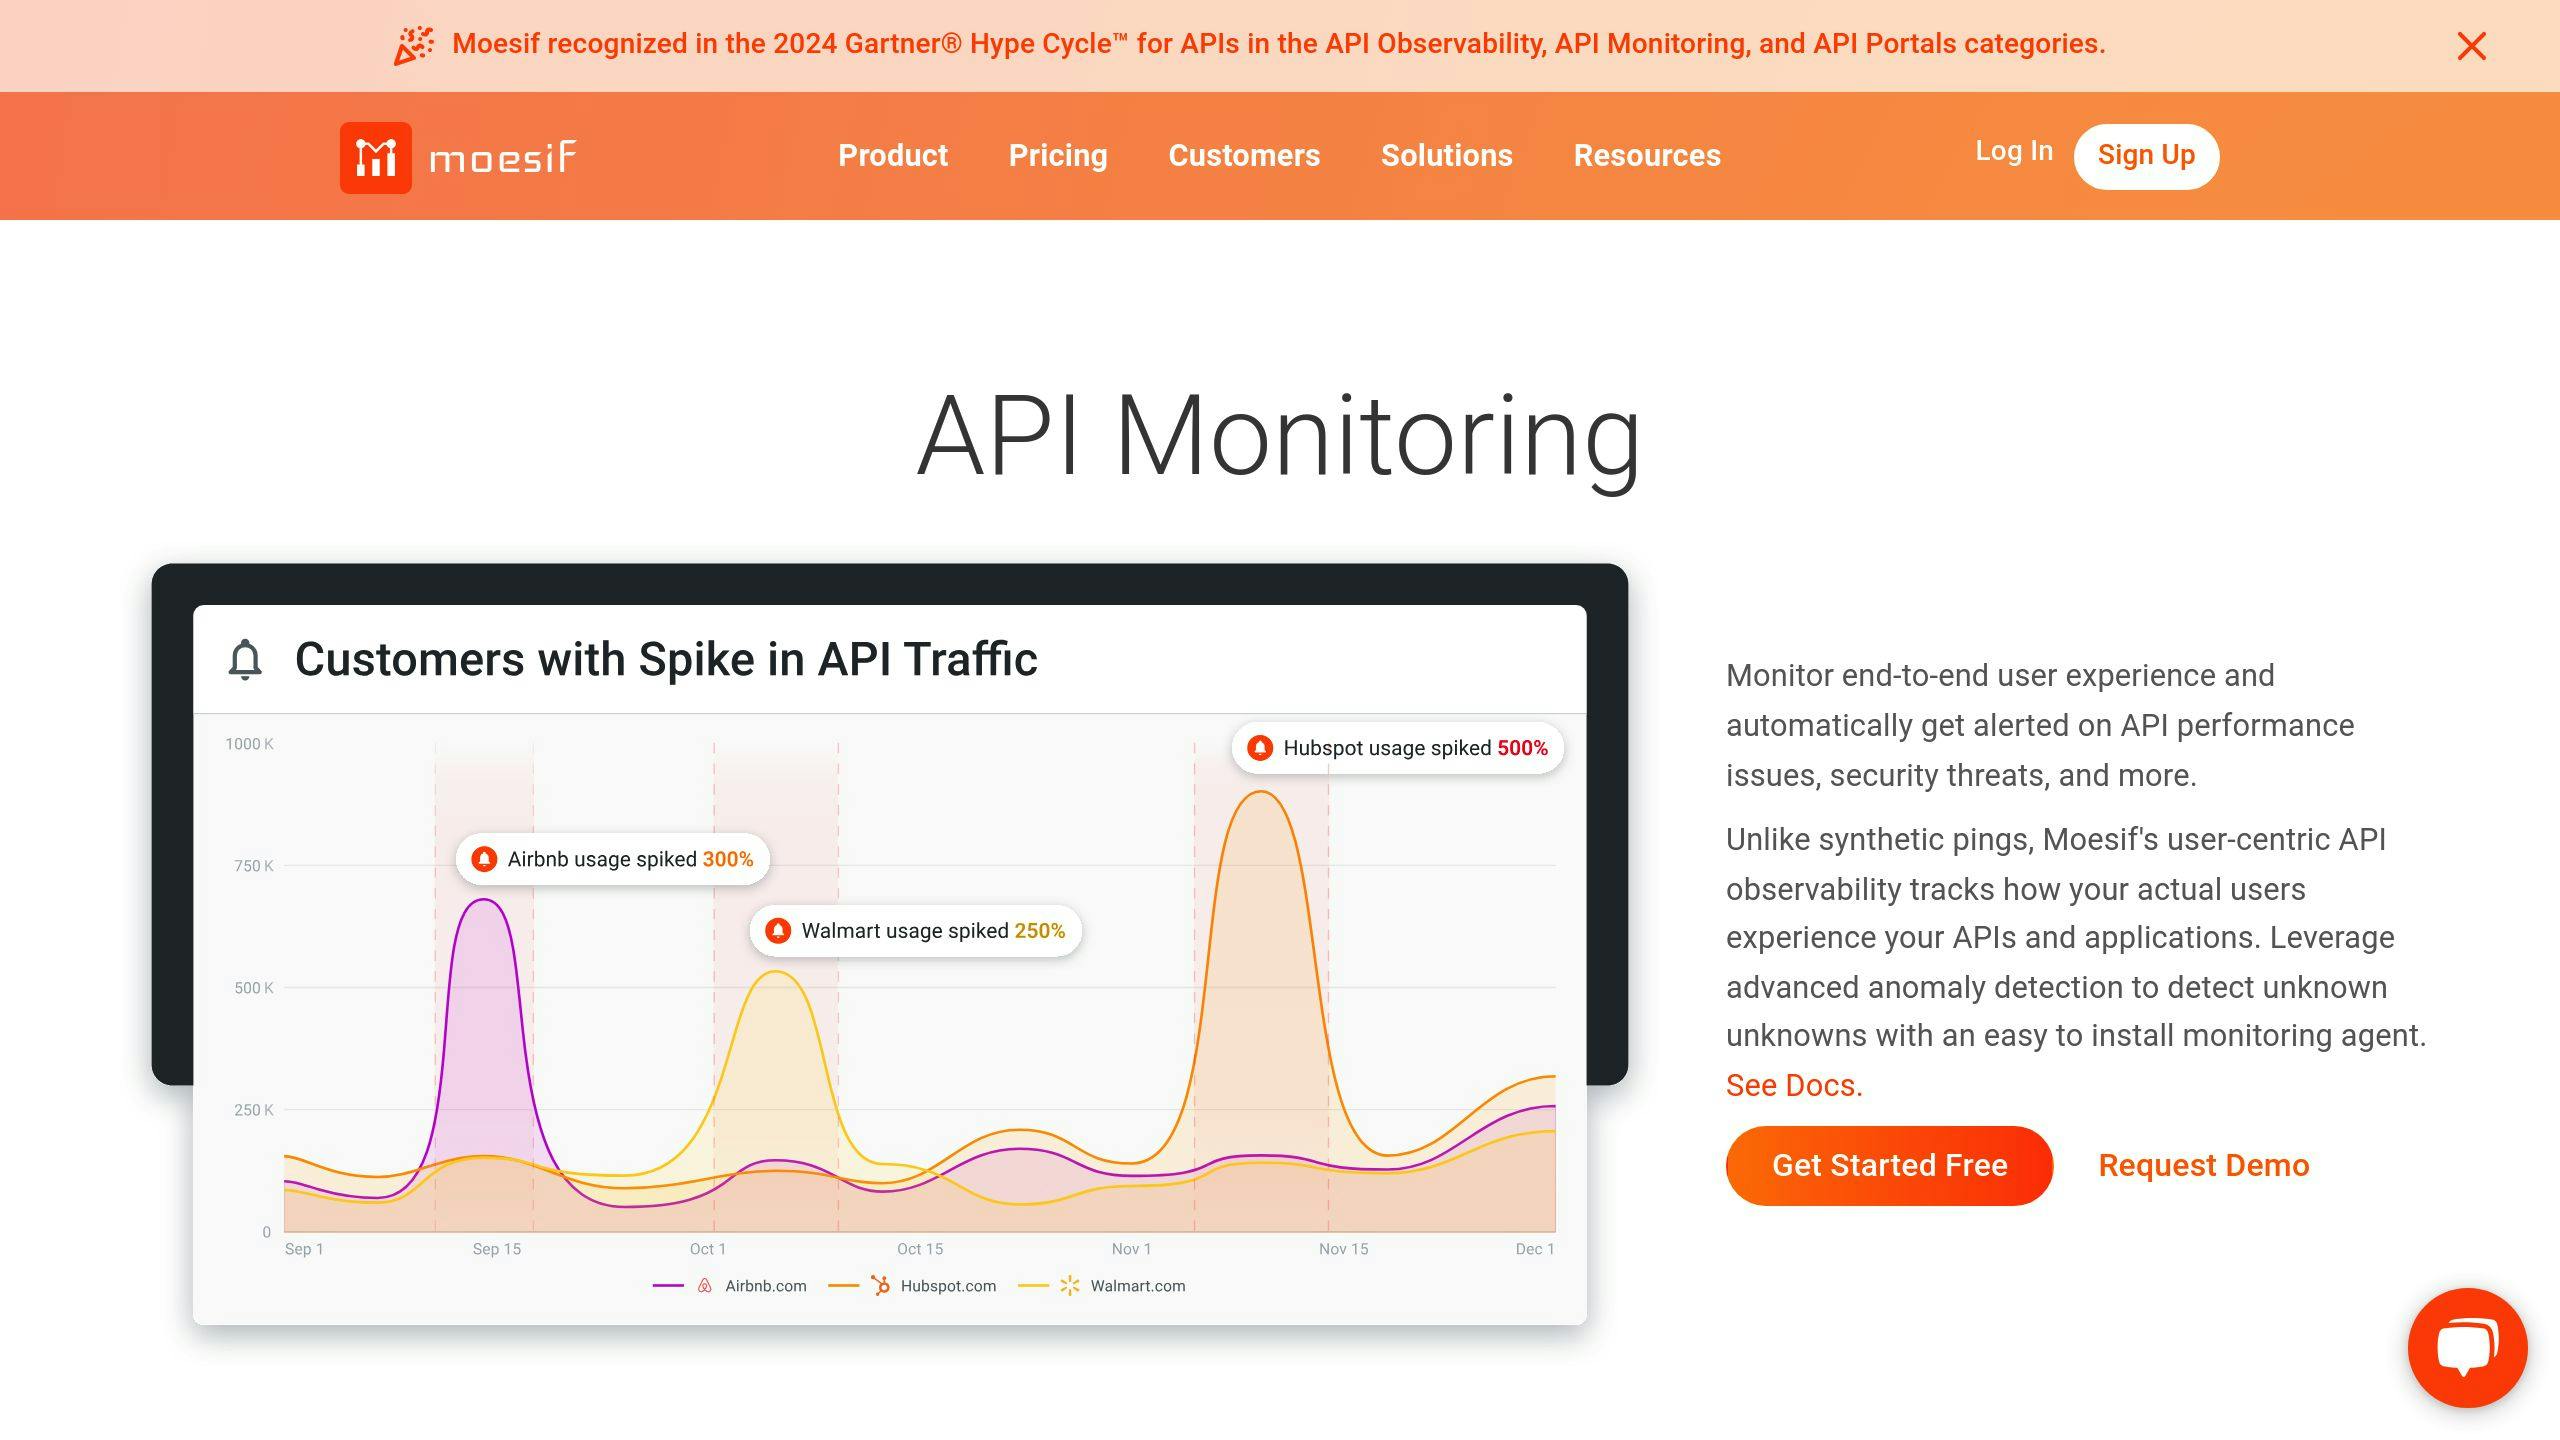
Moesif stands out by combining API monitoring with
[user behavior analytics](/blog/analytics-for-developers-using-your-api). This
makes it a strong choice for teams focused on both technical performance and
[API customer experience](/learning-center/rickdiculous-dev-experience-for-apis).
Here’s a quick look at its standout features:
| Feature | How It Helps |
| ---------------------------------- | ------------------------------------------------------------------------------------- |
| **Real-time Performance Tracking** | Quickly identifies performance issues and anomalies |
| **User Behavior Analytics** | Offers insights into API usage and user activities |
| **Customizable Alerting** | Sends tailored notifications for specific issues |
| **Full-stack Visibility** | Provides a comprehensive view of API interactions across the entire application stack |
What makes Moesif different is its ability to merge event logging with product
analytics. According to their documentation:
> Moesif provides powerful context and deep introspection through unlocked
> application-layer visibility
> [\[1\]](https://www.moesif.com/blog/api-strategy/What-is-API-Monitoring/)
The platform is particularly effective at error detection. It breaks down status
codes and offers transaction-level analysis, giving teams the tools to pinpoint
and resolve issues. You can also create custom dashboards for tracking key
metrics. Plus, its flexible pay-as-you-go pricing works for both startups and
larger organizations, scaling as you grow.
Moesif doesn’t just monitor APIs - it provides actionable insights into
performance, errors, and user engagement. This helps teams make informed
decisions to improve their APIs. The focus on user experience analytics gives a
clearer picture of how API performance affects customers, enabling more precise
improvements. We actually offer a
[Moesif analytics integration](https://zuplo.com/docs/policies/moesif-inbound?utm_source=blog)
to help Zuplo API developers improve their APIs.
While Moesif shines in user-focused analytics, tools like Postman specialize in
broader API testing and monitoring.
## 2\. Postman: API Testing and Monitoring Made Simple
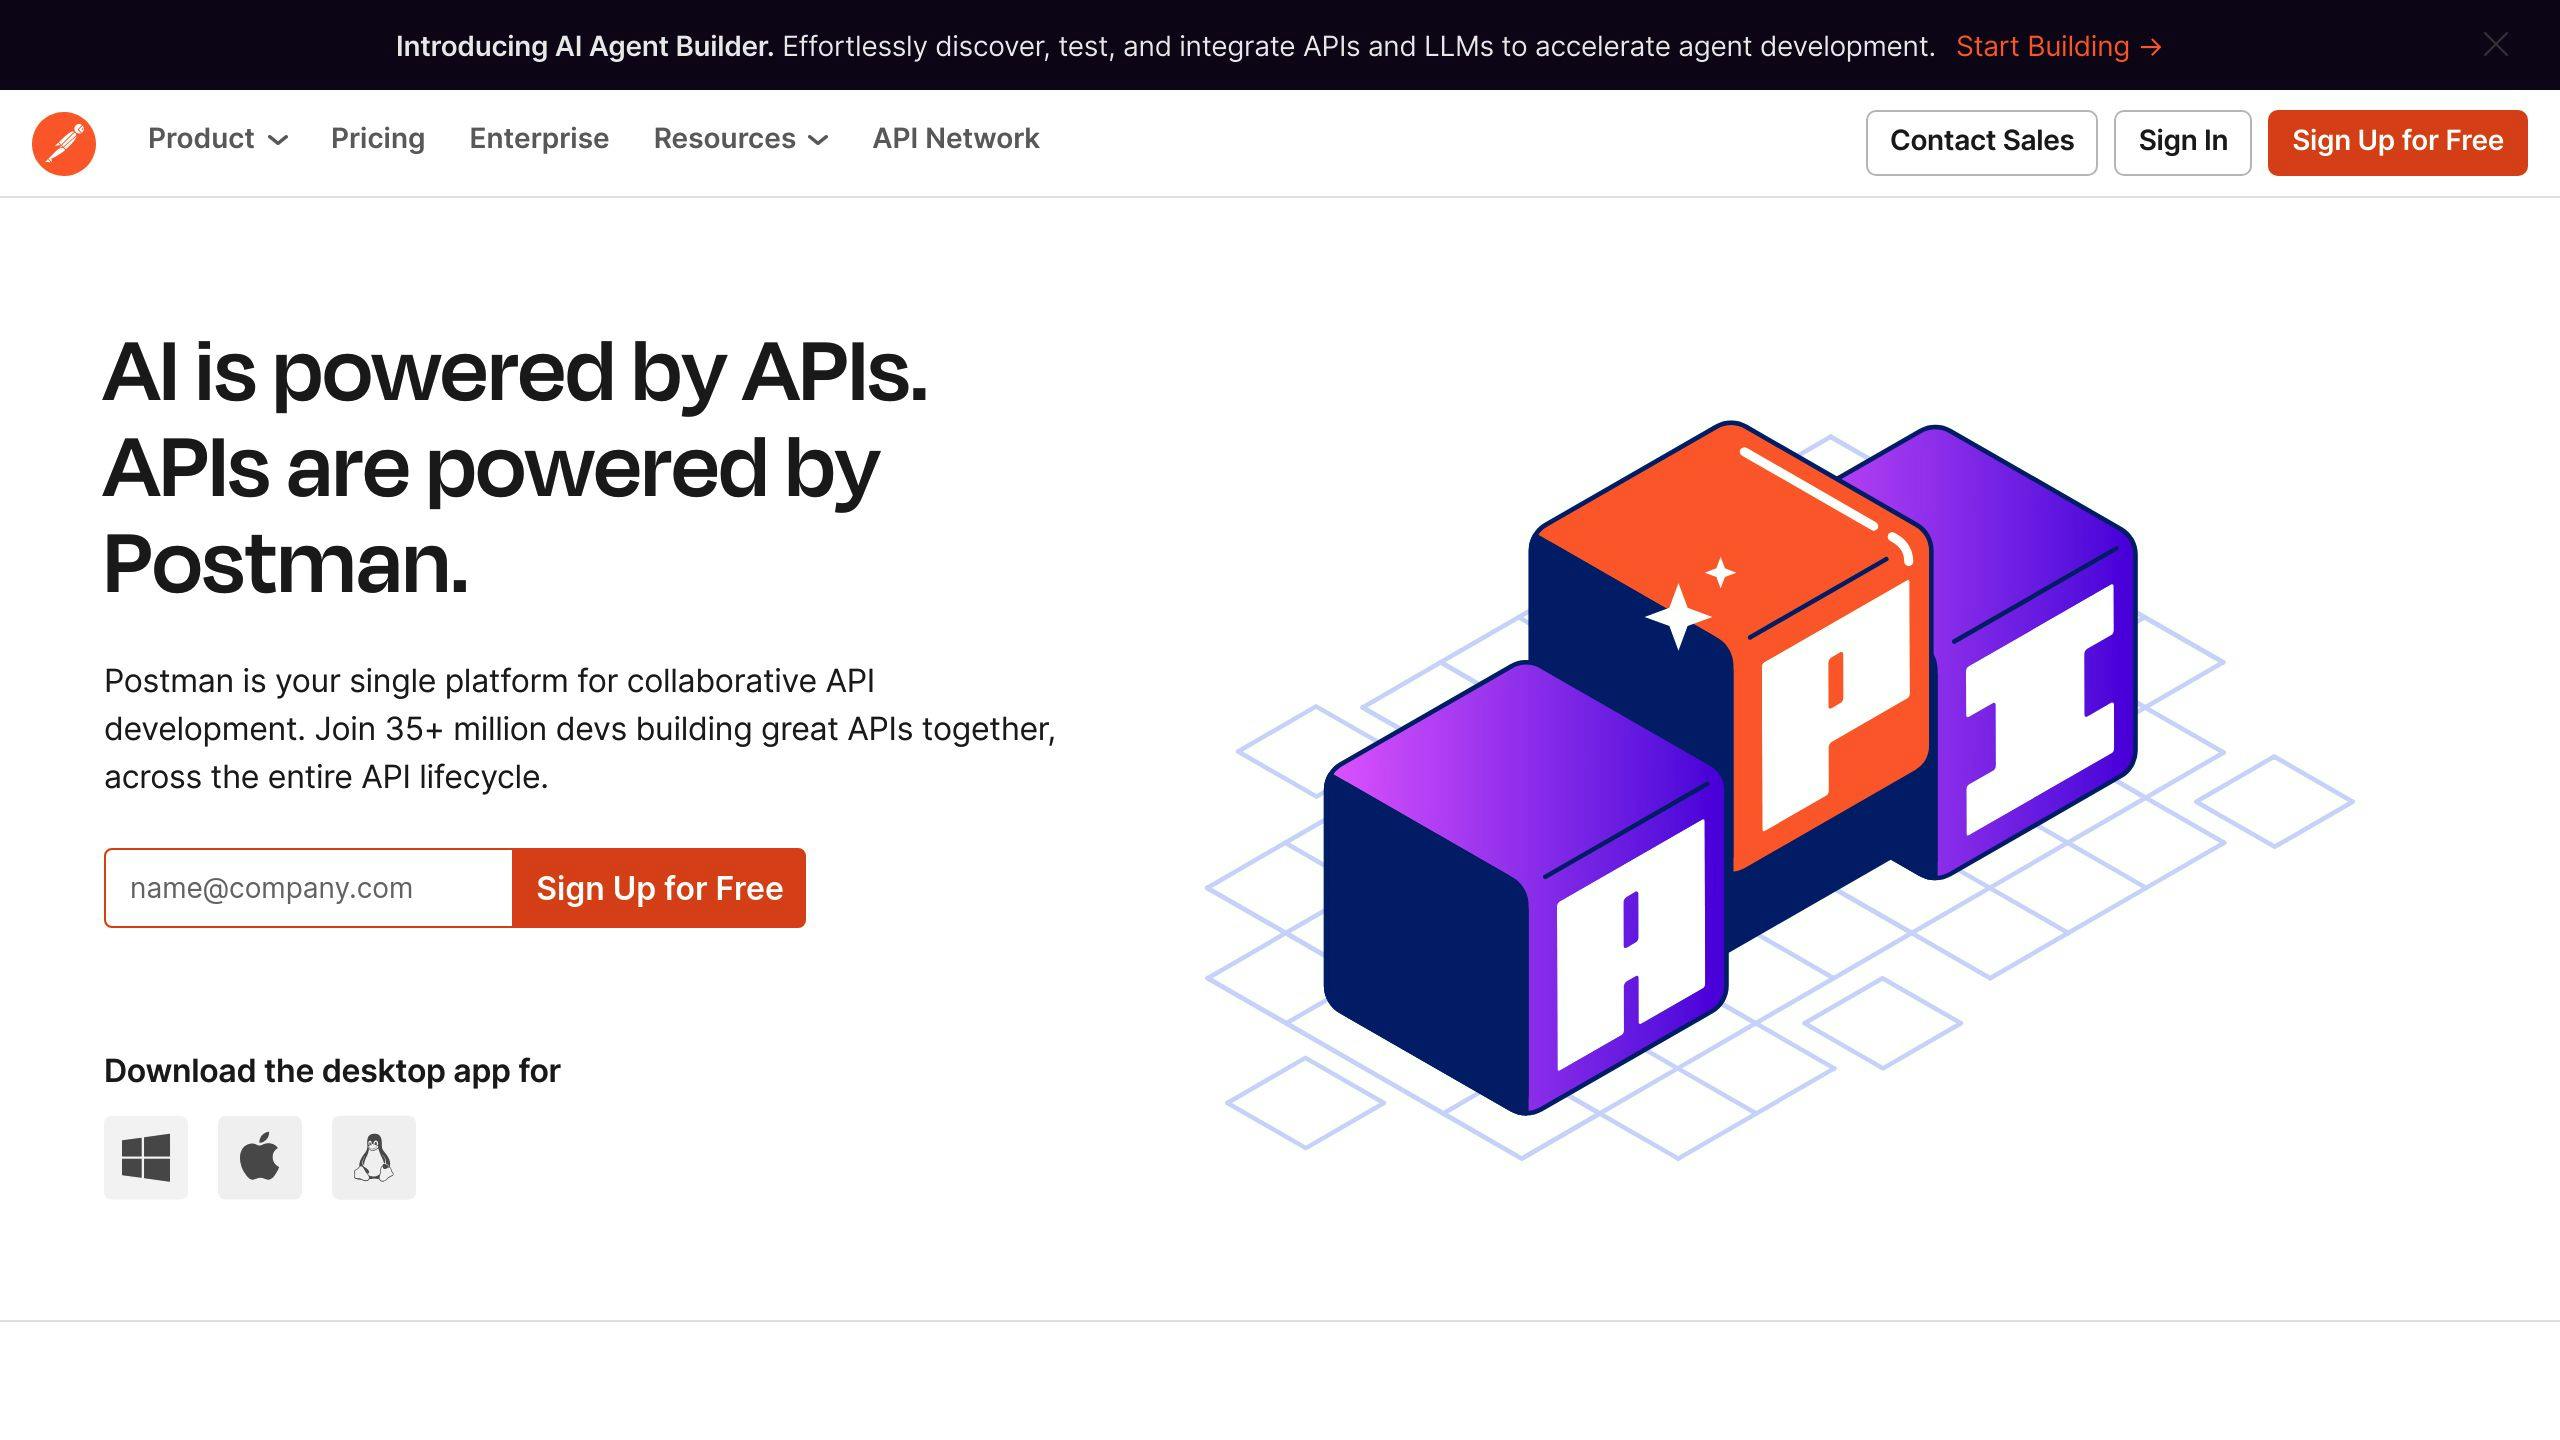
Postman has grown from a basic API client into a powerful platform that combines
testing, monitoring, and collaboration tools. Its real value lies in how easily
it fits into development workflows while offering extensive testing features.
Here’s a quick look at what makes Postman stand out for monitoring:
| Feature | What It Does |
| -------------------------- | ---------------------------------------------------------------------------------------------------------------------------------------------------- |
| **Real-time Monitoring** | Tracks performance and sends alerts instantly |
| **Automated Testing** | Runs scripts to validate APIs automatically |
| **Environment Management** | Handles separate setups for development, staging, and production |
| **CI/CD Integration** | Works with continuous testing via [Newman](https://learning.postman.com/docs/collections/using-newman-cli/command-line-integration-with-newman/) CLI |
Postman simplifies API testing by using JavaScript-based test scripts, which can
be easily integrated into CI/CD pipelines through its Newman CLI. It also
performs scheduled checks from different global locations, giving teams detailed
insights into API performance worldwide. Recent updates have added AI-powered
debugging that identifies root causes of failed monitor runs and suggests fixes
directly in the results, plus private API monitoring for internal APIs behind
firewalls.
Another key feature is Postman’s collaboration tools. Teams can share
[collections](/learning-center/mastering-api-definitions#postman-collections)
and test results, making it easier to manage API testing across distributed
teams and complex projects. This shared approach helps ensure consistent
practices, boosting API reliability and minimizing errors.
Postman offers flexible pricing options, including a free tier for basic testing
needs and paid plans for advanced monitoring and collaboration tools. Its mock
server feature is especially useful, letting teams simulate API responses and
test dependencies even when certain services aren’t available.
One practical use of Postman’s monitoring is simulating real-world API traffic.
By setting up schedules that mimic actual usage, teams can catch potential
issues before they affect users.
Compared to Moesif, which specializes in user behavior analytics, Postman shines
in testing and monitoring APIs. Its ability to integrate with tools like GitHub
and [Jenkins](https://www.jenkins.io/) makes it a go-to choice for teams looking
to
[optimize API reliability and performance](/learning-center/increase-api-performance).
If you’re after a more streamlined testing solution, Runscope is another option
worth exploring.
## 3\. Runscope: Simplified API Testing and Monitoring
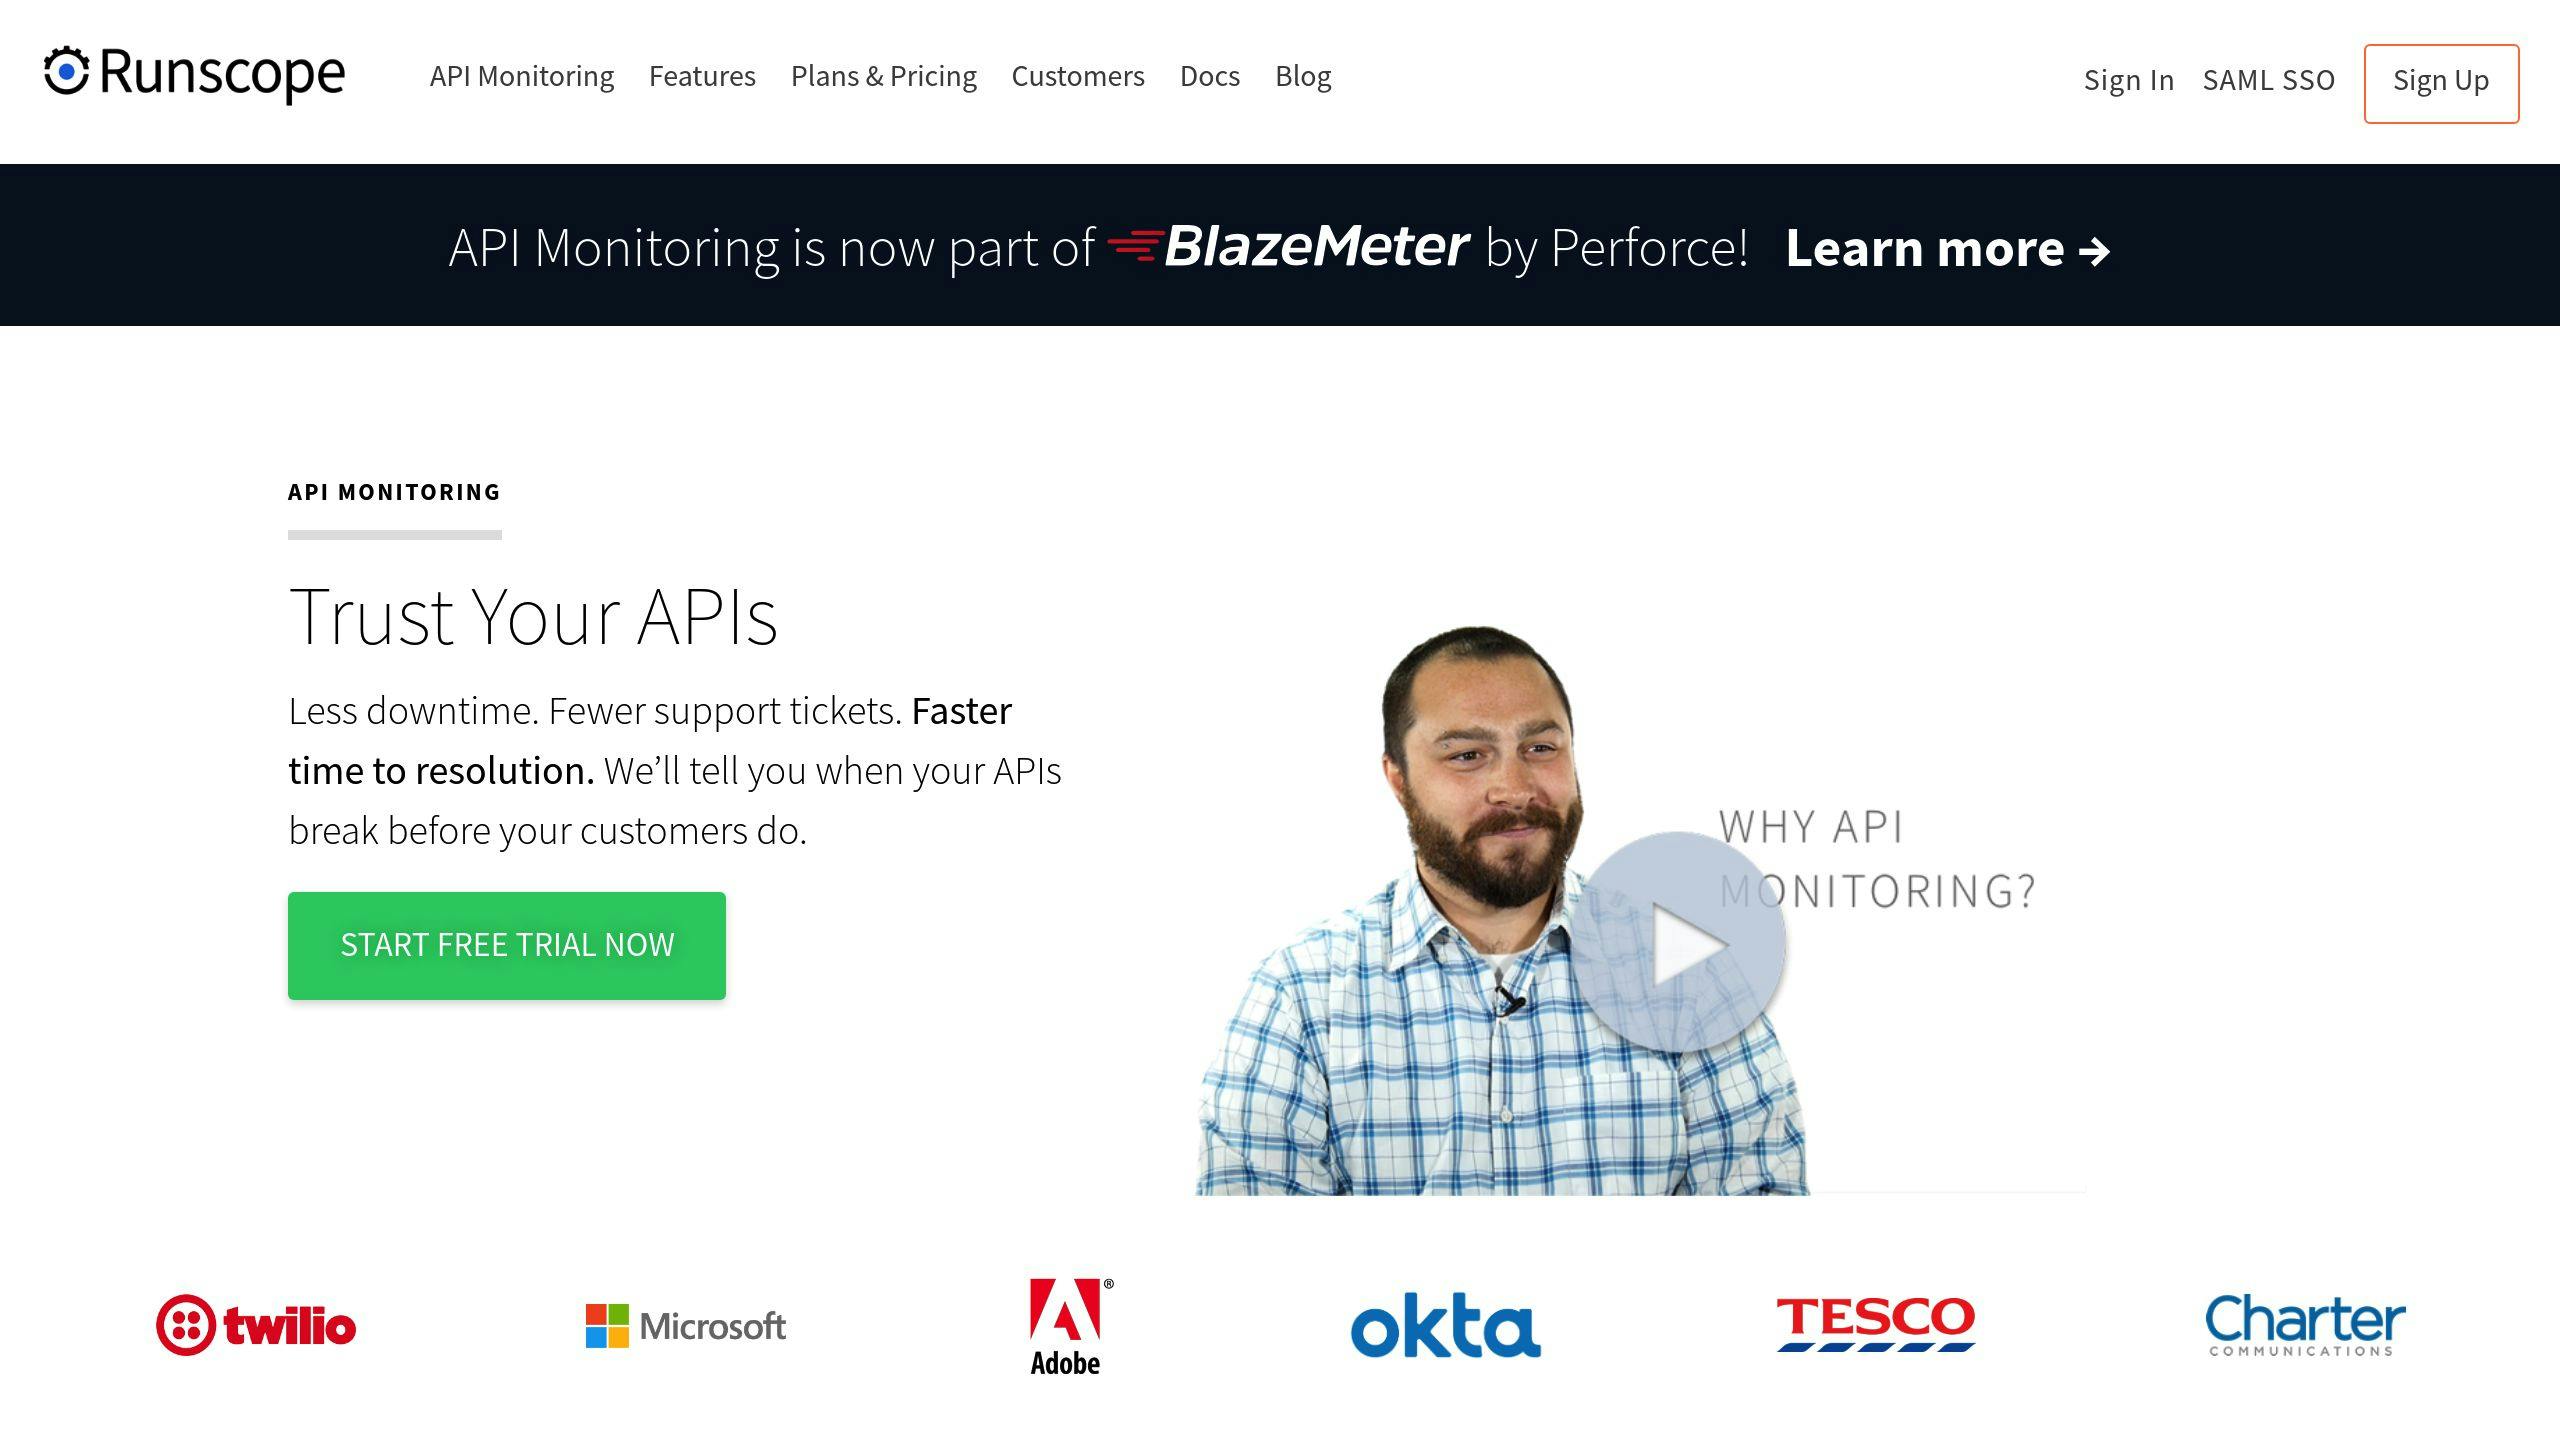
Runscope is a cloud-based platform designed for automated API testing and
real-time monitoring. It supports REST, SOAP, and GraphQL, making it suitable
for a range of API implementations.
| Feature | Description |
| --------------------- | ----------------------------------------------- |
| **Automated Testing** | Schedule tests and receive instant issue alerts |
| **Protocol Support** | Compatible with REST, SOAP, and GraphQL |
| **Integrations** | Works with GitHub, Jenkins, and Slack |
| **Global Monitoring** | Tracks performance across multiple regions |
Runscope's strength lies in detecting and diagnosing API issues before they
affect users. Its automated tools ensure APIs remain reliable across different
environments, while real-time alerts help teams respond quickly to potential
problems.
What makes Runscope stand out is its easy-to-use interface paired with advanced
monitoring features. It provides detailed performance analytics and error
tracking, enabling teams to keep a close eye on API health. With monitoring
locations spread across the globe, Runscope ensures consistent performance no
matter the region.
Pricing starts at $79/month, with more advanced features available in higher
tiers. Users frequently praise its testing capabilities and user-friendly
design, making it a go-to tool for maintaining API reliability.
Runscope also integrates smoothly with popular tools like GitHub, Jenkins, and
Slack, streamlining workflows and improving issue tracking. While it focuses
primarily on testing and monitoring rather than API development or
documentation, its straightforward approach is ideal for teams prioritizing
performance and stability.
Another monitoring tool with a slick user interface and that is well suited for
larger organizations is API Context.
## 4\. API Context: Powerful Metrics With Just a URL

API Context is an API monitoring tool that helps you ensure end-to-end API
performance. Its predecessor, API Metrics, was a powerful tool for measuring
performance and evaluating the quality of APIs you offer. All it needs is your
API's URL to start testing.
| Feature | Description |
| ------------------------- | ------------------------------------------------------------------------------------------------------------ |
| **Observability focused** | Real-time visibility into API calls, latencies, and performance bottlenecks |
| **Contextual debugging** | Emphasizes “context” around each API request, enabling teams to trace issues across distributed environments |
| **Actionable alerts** | Configurable alerts that integrate with popular incident management tools |
Although specialized tools like API Context can be useful, perhaps you are a
smaller team that is looking for a more integrated solution across your API
tooling stack. Treblle might be the right choice for you.
## 5\. Treblle: All-in-one solution for API Tooling

Treblle is an
[API Intelligence platform](https://treblle.com/blog/what-does-api-intelligence-platform-even-mean)
that embeds directly into your API development workflow, offering real-time
insights and powerful tooling for documentation, governance, security, and of
course -
[observability](./2025-07-10-exploring-the-world-of-api-observability.md). It
helps teams understand and optimize their APIs with ease — without the
complexity or high costs. With a free tier for indie developers and
cost-effective pricing for growing teams, Treblle makes API intelligence
accessible to everyone.
| Feature | Description |
| -------------------------------------- | ----------------------------------------------------------------------------------------------- |
| **Real-time monitoring and debugging** | Captures requests in real time, showing payloads, response times, and error details immediately |
| **Developer-friendly** | Quick to set up with minimal code changes, plus extensive framework integrations |
| **All-in-one** | Don't need to pay for and integrate other solutions for docs and governance |
For a broader solution that combines API monitoring with system-wide
observability, Sematext offers an alternative worth considering.
## 6\. Sematext: Unified Monitoring for APIs and More
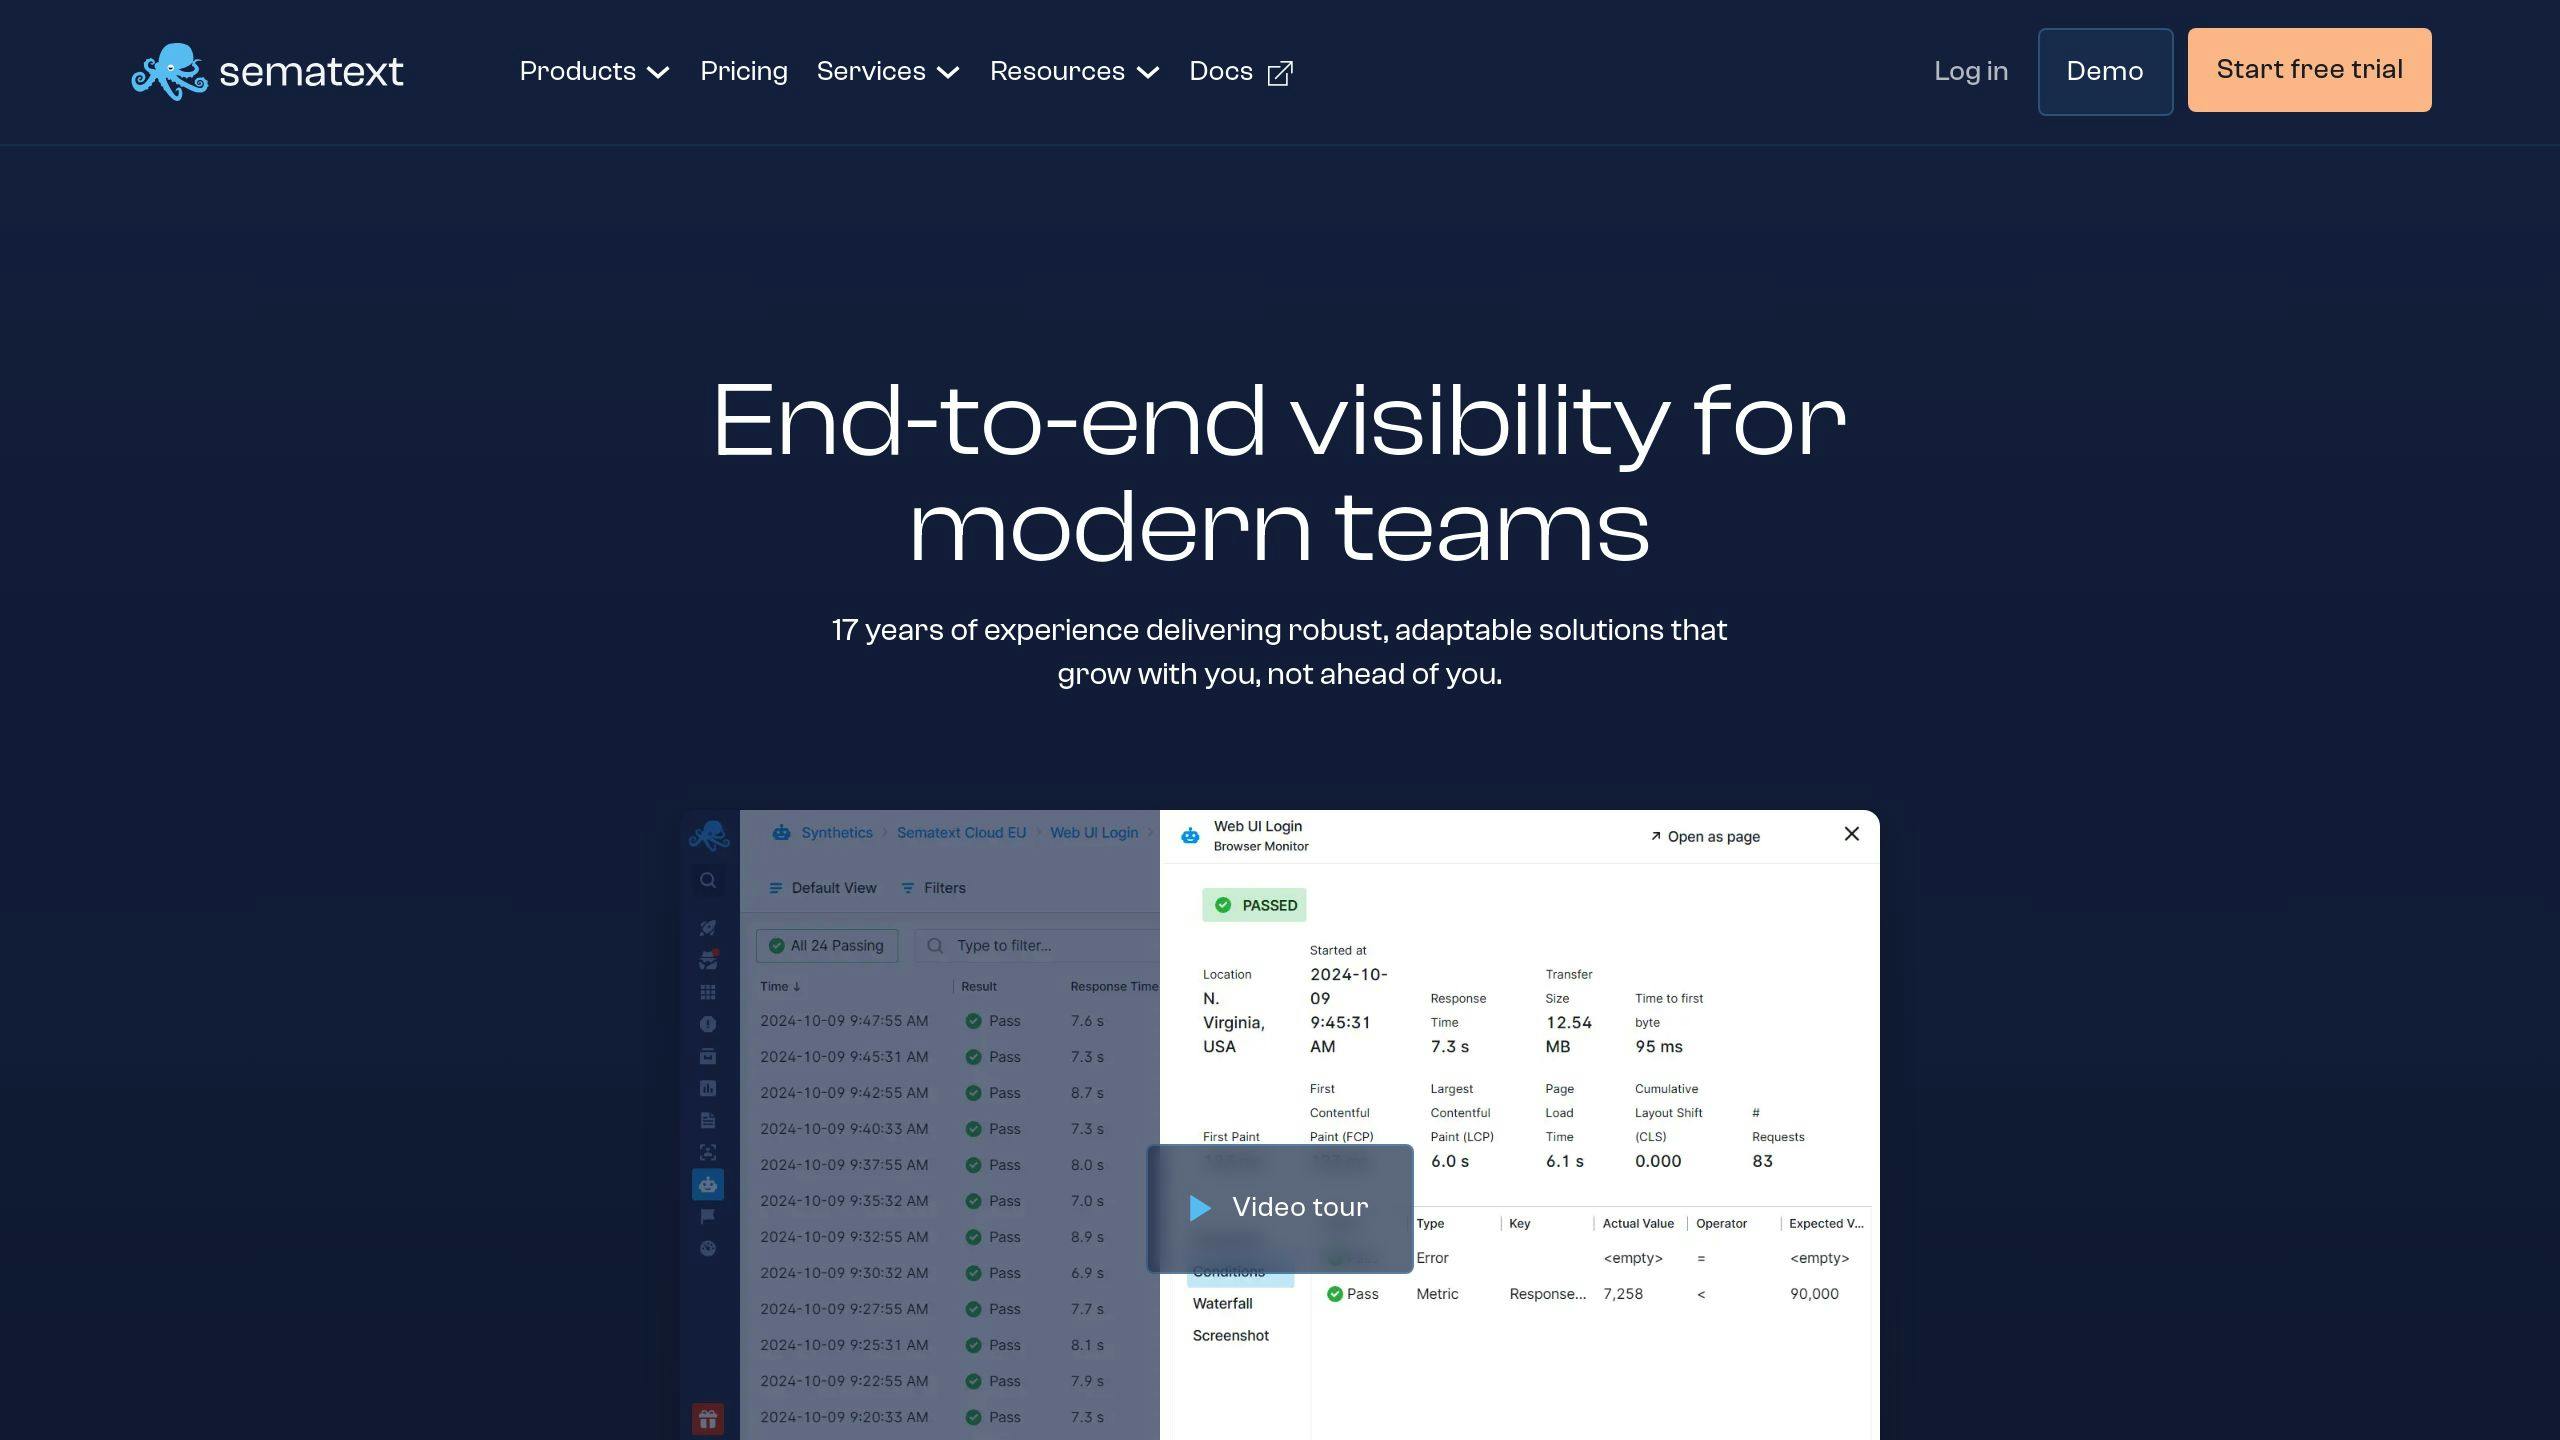
Sematext offers a well-rounded monitoring platform that goes beyond just
tracking APIs. It provides **real-time insights** into your entire application
stack, making it a go-to tool for developers.
| Feature | What It Does |
| ------------------------ | ---------------------------------------------------------------------------------------------------------------------------- |
| **Performance Tracking** | Monitors API response times, error rates, and throughput |
| **Monitoring Scope** | Covers APIs, logs, and infrastructure |
| **Alert System** | Custom alerts and anomaly detection |
| **Integration Support** | Works with [Docker](https://www.docker.com/), [Kubernetes](https://kubernetes.io/), [AWS](https://aws.amazon.com/), and more |
| **Visualization** | Offers tools like waterfall charts and custom dashboards |
What makes Sematext stand out is its ability to connect the dots between
different data points. It links API performance with server metrics and logs,
helping you quickly find and fix problems. The visualization tools make it
easier to spot delays, while the anomaly detection system catches unusual API
behavior early, reducing downtime.
Sematext has earned a solid 4.5/5 rating on Gartner Peer Insights, showing it’s
trusted by many. Its API monitoring focuses on critical metrics like response
times and throughput, ensuring smooth performance. Pricing starts at $49/month,
offering flexibility for different needs.
The platform also integrates directly with tools like Docker, Kubernetes, and
AWS, simplifying workflows by reducing the need for multiple monitoring tools.
This integration-focused approach provides thorough oversight without added
complexity.
While Sematext shines in unified monitoring, tools like Datadog push
observability even further with their full-stack monitoring capabilities.
## 7\. Datadog: Full-Stack Monitoring with API Insights
Datadog stands out by linking API performance with infrastructure metrics,
helping teams resolve issues faster. It's a go-to choice for managing complex
API setups thanks to its detailed monitoring features.
| Feature | Capability |
| ----------------------- | ----------------------------------------------------------- |
| **Performance Metrics** | Tracks response times, error rates, and throughput |
| **Security Monitoring** | Monitors authentication and flags authorization errors |
| **Integration Support** | Works with APM tools, logging systems, and cloud providers |
| **Alert System** | Offers customizable alerts for performance thresholds |
| **Visualization** | Includes real-time dashboards and distributed tracing views |
By connecting API performance to infrastructure data, Datadog helps teams
quickly pinpoint and fix problems. For example, if an API endpoint slows down,
the platform can trace the issue back to an infrastructure bottleneck, saving
valuable time.
Infrastructure monitoring starts at $15 per host per month, though adding APM
and synthetic API testing increases the cost significantly. Datadog also
strengthens security by tracking authentication patterns and detecting breaches
in real time. Custom alerts ensure teams can tackle problems before they
escalate.
Its native integrations and unified dashboard make monitoring easier across
multiple platforms. Support for APM tools and distributed tracing adds another
layer of functionality, setting Datadog apart from more basic monitoring tools.
Though it may take more effort to set up initially, Datadog’s detailed insights
and full-stack monitoring capabilities make it a solid choice for teams needing
a deeper understanding of their APIs and infrastructure.
## 8\. Smartbear AlertSite

Smartbear is well known within the API management and tooling space - with a
major claim to fame being their stewardship of the
[OpenAPI standard](/learning-center/mastering-api-definitions). Their AlertSite
offering claims to be an "Early Warning System" for your APIs and web apps.
| Feature | Description |
| ------------------------------------- | ----------------------------------------------------------------------------------------------------------- |
| **Synthetic monitoring** | Comprehensive checks from a global network, ensuring performance metrics from multiple geographic locations |
| **End-to-end transaction monitoring** | Can simulate multi-step API calls or user flows for deeper performance analysis |
| **Robust SLA monitoring & reporting** | Works with GitHub, Jenkins, and Slack |
| **Global Monitoring** | Offers detailed reports for meeting compliance or contractual SLA obligations |
Smartbear's offering is definitely targeted towards enterprises - especially
those with large, complex engineering projects that run across the world.
AlertSite can sort of be a one-stop-shop for the large organizations to get
consistent metrics across APIs, Mobile and Desktop web apps, and other
cloud-based applications.
## Comparison of API Monitoring Tools
This table outlines the key features of various API monitoring tools, helping
you identify the best fit for your team's needs.
| Feature | Moesif | Postman | Runscope | Sematext | Datadog |
| -------------------------- | ---------------------- | --------------------------- | ---------------------- | ------------------------ | --------------------------- |
| **Strength** | User-focused analytics | API testing & collaboration | Simple monitoring | Broad monitoring scope | Full-stack system insights |
| **Monitoring & Analytics** | Focus on user behavior | Metrics for testing | Basic performance data | Infrastructure-wide view | End-to-end visibility |
| **Alert System** | Real-time, detailed | Basic alerts | Standard options | Customizable alerts | Advanced, AI-driven alerts |
| **Integration Options** | Wide API support | CI/CD integration | Limited integrations | Multiple system support | Extensive integrations |
| **Ideal Users** | Product teams | Development teams | Small to medium teams | Infrastructure teams | Enterprise-level operations |
### Tool Highlights
**Moesif** stands out for its detailed API analytics and focus on user behavior.
Its real-time event logging and advanced alerting features make it a great
option for teams prioritizing user experience and
[API governance](/learning-center/how-to-make-api-governance-easier)
[\[3\]](https://www.moesif.com/blog/technical/api-development/API-Monitoring/).
**Postman** is a go-to for API testing and development. With features like
seamless CI/CD integration and automated testing through Newman, it ensures
continuous quality assurance during development
[\[2\]](https://testfully.io/blog/postman-api-testing/).
**Runscope** simplifies API monitoring, making it a solid choice for smaller
teams looking for straightforward functionality without complex setup. While it
lacks deep analytics, its ease of use is a major advantage.
**API Context** is great for teams needing an immediate feedback loop on live
APIs with rich contextual data for debugging.
**Treblle** is well suited for smaller teams or startups that want a clean,
quick-deploy solution combining monitoring, logging, and documentation. Their
observability offering provides a modern, UI-driven approach with real-time
analytics and immediate alerting.
**Sematext** offers monitoring beyond APIs, covering various infrastructure
components. This makes it ideal for teams managing multiple systems and seeking
a consolidated monitoring solution.
**Datadog** shines with its all-encompassing monitoring capabilities, linking
API performance to infrastructure metrics. This helps teams quickly diagnose and
resolve issues with a complete view of their tech stack
[\[1\]](https://www.moesif.com/blog/api-strategy/What-is-API-Monitoring/).
**Smartbear AlertSite** is well suited to larger enterprises or organizations
with mission-critical APIs needing distributed synthetic monitoring at scale.
Teams requiring advanced capabilities like multi-step transaction tracing,
strong SLA reporting, and broad protocol support should seriously consider it.
Each tool brings something different to the table - whether it's Moesif's focus
on user data, Postman's testing capabilities, Runscope's simplicity, Sematext's
broad monitoring, or Datadog's comprehensive insights. Choose the tool that
aligns with your team's needs and long-term goals.
### Honorable Mentions
#### Zuplo
Zuplo is not a dedicated API monitoring tool, but it does have API monitoring
and analytics built into its API management platform. These logs come directly
from your gateway, with no additional setup required. This video highlights some
of the data the platform surfaces:
What's cool about Zuplo is that it also integrates those API analytics into the
auto-generated developer portal, so your _API users can view their own API usage
analytics_:
#### Checkly
Checkly offers
[API Monitoring](https://www.checklyhq.com/product/api-monitoring/) and
alerting - but it's more basic and productized than the other offerings
mentioned here.
## How to Pick the Right API Monitoring Tool for Your Stack
The tools we've discussed each bring distinct features to the table, but
selecting the right one comes down to understanding your specific needs. Picking
the right API monitoring tool is essential for keeping your APIs secure,
efficient, and performing at their best. Over time, API monitoring tools have
become more advanced, offering capabilities like real-time tracking, detailed
analytics, and security management.
### Key Factors to Consider
When assessing API monitoring tools, focus on how well they match your
development environment and business goals. Pay attention to:
- Compatibility with your protocols and current infrastructure
- Ability to scale as your needs grow
- Effectiveness of alert systems and response mechanisms
- Quality of analytics and reporting features
### Improving Development Operations
Good monitoring tools provide actionable insights that help teams spot and fix
issues before they affect users. This proactive approach enhances API
performance and boosts user satisfaction while improving operational efficiency.
### Balancing Security and Performance
Modern tools need to handle both security and performance. This means detecting
unusual activity, keeping an eye on usage metrics, and analyzing logs for
potential weaknesses. By doing so, they provide robust protection without
compromising speed or reliability.
### Cost and Value
Look at how the tool’s pricing aligns with its features and ability to grow with
your needs. For instance, Moesif’s pay-as-you-go model
[\[1\]](https://www.moesif.com/blog/api-strategy/What-is-API-Monitoring/) allows
teams to expand their monitoring efforts as their API usage increases. This
approach ensures you’re getting both affordability and comprehensive coverage.
### Getting the Most Out of Your Tool
To fully benefit from your chosen tool, start with clear goals, roll out the
implementation gradually, set up meaningful alerts, and regularly review the
data to fine-tune your monitoring process. Effective API monitoring is about
more than just picking a tool - it’s about integrating it into your workflow and
continuously improving based on real-world performance and team feedback.
### Gateway Compatibility
Most enterprise-grade API monitoring tools will have built-in integrations with
your API gateway of choice. Many general tools (ex. Datadog) will likely not
offer these, and you will need a
[gateway with OpenTelemetry support](/blog/enhance-your-api-monitoring-with-zuplo-opentelemetry-plugin)
to easily transfer data. Zuplo's
[OpenTelemetry plugin](https://zuplo.com/docs/articles/opentelemetry) supports
tracing and logging, and Zuplo's
[metrics plugins](https://zuplo.com/docs/articles/metrics-plugins) handle
metrics export to Datadog, Dynatrace, New Relic, and any
OpenTelemetry-compatible backend. If you'd like to implement robust API
monitoring on your APIs —
[reach out to our team](https://zuplo.com/meeting?utm_source=blog) — we're happy
to help.