

Zuplo OpenTelemetry
Zuplo ships with an OpenTelemetry plugin (@zuplo/otel) that instruments your
API and exports traces and logs in OpenTelemetry format. The quickest way to use
it is Zuplo's built-in tracing: add the plugin and your traces are stored by
Zuplo and shown in the portal's Observability tab, with no collector to run
or backend to host. Built-in tracing is available on every plan. You can also
export to your own OpenTelemetry backend (an Enterprise feature), or to both at
once.
Tracing
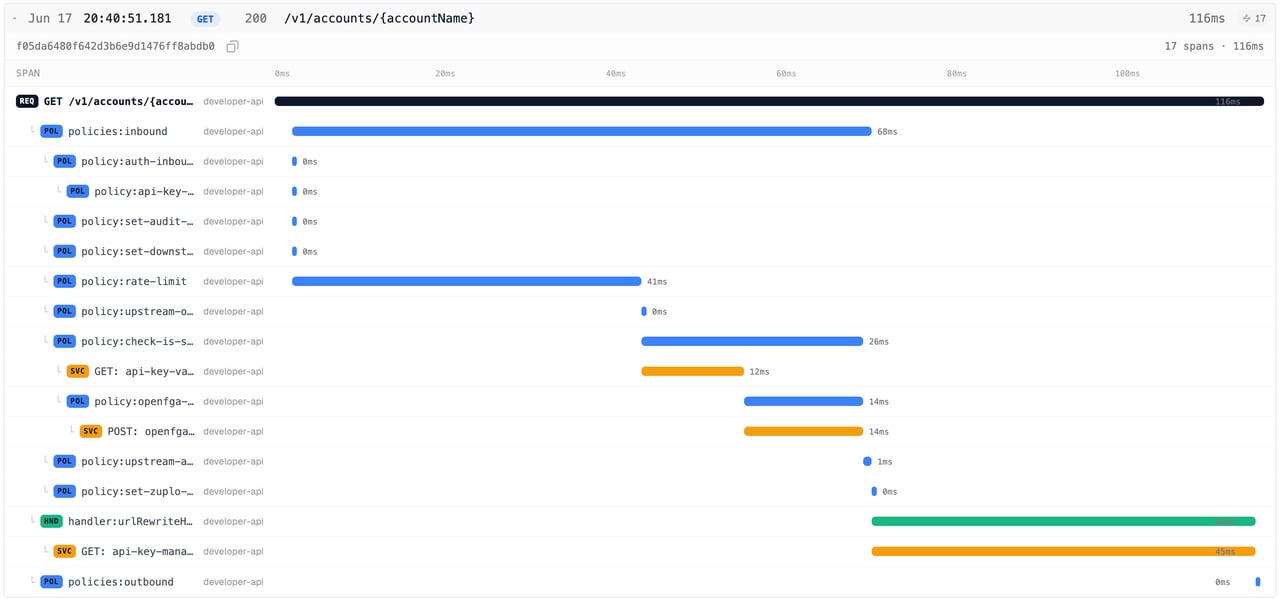
Tracing helps you monitor performance, identify bottlenecks, and troubleshoot issues in your Zuplo API. The OpenTelemetry plugin automatically instruments your API, so you get timings for each request along with spans for policies, handlers, and subrequests. It supports trace propagation (W3C headers by default), so you can follow a request from the client through to your backend.
What's Traced?
By default, when the OpenTelemetry plugin is enabled, the following is traced:
- Request: The entire request lifecycle is traced, including the time taken to process the request and send the response.
- Inbound Policies: The time taken to execute all inbound policies as well as each policy is traced.
- Handler: The request handler is traced.
- Outbound Policies: The time taken to execute all outbound policies as well as each policy is traced.
- Subrequests: Any use of
fetchwithin your custom policies or handlers is traced.
Limitations
One important limitation to keep in mind is that the clock will only increment
when performing I/O operations (for example when calling fetch, using the
Cache APIs, etc.). This is a limitation imposed as a security measure due to
Zuplo's serverless, multi-tenant architecture. In practice this shouldn't impact
your ability to trace, as virtually any code that isn't I/O bound is fast.
Setup
Add the OpenTelemetryPlugin in your zuplo.runtime.ts file. Where it sends
data is up to you: Zuplo's built-in storage, your own backend, or both.
Send Traces to Zuplo
Add the plugin with no configuration. It sends traces to Zuplo and names the service after your project:
Code
When you created your project, Zuplo added this plugin with a sampling ratio already set.
Deploy your project and open the Observability tab to see traces.
Each trace is tagged with the account, project, deployment, and environment it
ran in, plus the request ID (the zp-rid value) that also appears on your
logs, so you can move between a request's logs and its trace. How
long traces are kept depends on your plan — see
data retention.
Traces reach Zuplo only from deployed environments. During local development
(zuplo dev) there is no Zuplo ingest to send to, so the plugin logs a startup
warning and skips the Zuplo destination. Any other destinations you configure
still run.
Export to Your Own Backend
Enterprise Feature
Exporting to your own OpenTelemetry backend is available as an add-on as part of an enterprise plan. If you would like to purchase this feature, please contact us at sales@zuplo.com or reach out to your account manager.
Most enterprise features can be used in a trial mode for a limited time. Feel free to use enterprise features for development and testing purposes.
To send traces to an OpenTelemetry service such as
Honeycomb, Middleware,
Dynatrace, Jaeger, or
others, configure an exporter with the
service's url and headers. It's common for providers to use a header for
authorization. Configuring an exporter sends traces there instead of Zuplo.
OpenTelemetry Protocol
The Zuplo OpenTelemetry plugin only supports sending data in JSON format. Not all OpenTelemetry services support the JSON format. If you are using a service that doesn't support JSON, you will need to use a tool like the OpenTelemetry Collector that can convert the JSON format to the format required by your service.
Code
Sampling and Post-Processing
The plugin supports additional options for advanced use cases, including head sampling and post-processing of spans before export.
Code
Logs and Traces Together
To export logs as well as traces, use the top-level traceUrl, logUrl, and
headers properties instead of the exporter object. The plugin supports both
shapes, but they're mutually exclusive: exporter configures tracing only,
while traceUrl and logUrl configure tracing and logging together with a
shared set of headers. See Logging for how to emit log records.
Code
Send Traces to Zuplo and Your Own Backend
You aren't limited to one destination. To deliver traces to Zuplo and your own
backend at the same time, add a span processor for each. Zuplo is represented by
a ZuploSpanExporter. The processors batch and flush independently, so a slow
or failing backend doesn't hold up the other:
Code
Performance and Sampling
Tracing isn't free. The plugin instruments every request: it opens spans for the
request, each policy, the handler, and any fetch subrequests, and holds them
in memory until the request finishes. Spans are exported after the response is
sent, so tracing adds little to any single response time, but the CPU and memory
it consumes per request reduce the headroom available for the next one. On
high-throughput APIs, that shows up as lower peak throughput and higher tail
latency.
Sample traces on any API that runs at a high request rate — high-RPS production
traffic, latency-sensitive service-to-service calls, or an API you're about to
load test. A ratio of 0.1, which keeps 10% of
traces, is the standard starting point: enough traffic to see how the API
behaves, without paying the export cost on every request. Tracing every request
is a reasonable default during development and for APIs at moderate request
rates.
Sample a Percentage of Traces
Set sampling.headSampler.ratio to the fraction of traces to keep. The ratio
applies to every destination, including Zuplo's built-in storage. When you
created your project, Zuplo set it up this way: every request traced in your
working copy, 10% everywhere else.
Code
Set ratio to a constant to use one value everywhere. Zuplo populates
ZUPLO_ENVIRONMENT_STAGE, which reads working-copy in your working copy and
production, preview, or local elsewhere, so local development
(zuplo dev) samples at 10% along with deployed environments. See
system environment variables
for the full list.
By default, traces whose root span ends in an error are exported whatever the
ratio, so errors stay debuggable on a heavily sampled API. Supplying your own
sampling.tailSampler replaces that behavior.
Sampling cuts the volume of trace data exported and stored, which lowers export overhead and backend cost. The per-request instrumentation still runs on every request, so sampling reduces the cost of tracing rather than removing it.
Disable Tracing
Sampling leaves some per-request work in place. Where you need none of it — measuring the gateway's raw capacity, or squeezing the last of the headroom out of a high-RPS environment — turn tracing off instead.
To remove the overhead entirely, don't register the plugin. Gate it on an environment variable so you can control tracing per environment without changing code:
Code
Set TRACING_ENABLED to true on the environments you want traced and leave it
unset everywhere else. Tracing is off unless you opt in, so an environment built
for maximum throughput — or for a load test — carries no tracing overhead until
you ask for it.
Where the plugin doesn't run, traces stop appearing in the Observability tab for that environment. Request analytics and logs come from a separate pipeline, so they aren't affected.
Account for Logging Too
Logging costs compute and memory per request the same way tracing does. On a high-throughput API, log the events you'd act on rather than everything that happens, and keep custom log properties small. Sampling traces while logging verbosely on every request moves the cost rather than removing it. See Performance Under High Load.
Logging
The plugin can also export logs in OpenTelemetry format. Logs are sent to your
own endpoint configured with the logUrl property (see
Logs and Traces Together); Zuplo's built-in storage
covers traces today, with managed logs and metrics planned for future releases.
To emit OpenTelemetry logs from your handlers and policies, use the
context.log object:
Code
You can also set additional custom log properties using
context.log.setLogProperties!:
Code
After setting a custom property, all subsequent log messages will include that
property. These logs are exported to the configured log endpoint in
OpenTelemetry format: the log message is in the message field and the custom
properties are in the attributes field.
Custom Tracing
You can add custom tracing to your Zuplo API using the OpenTelemetry API. The example below shows how to implement tracing in a custom policy.
Code
This will result in the following spans:
Code