Distributed tracing helps you identify and fix bottlenecks in distributed systems by tracking how requests move through services. Here’s what you need to know:
- What It Does: Tracks request paths, durations, and errors to locate slowdowns.
- Common Bottlenecks: Issues like network latency, database overload, resource exhaustion, and API dependency delays.
- How It Helps: Visualizes service interactions, highlights delays, and combines trace data with system metrics (e.g., CPU, memory, network).
- Getting Started: Use tools like Jaeger, Zipkin, or OpenTelemetry. Focus on critical paths, set smart sampling rules, and align trace data with system metrics.
- Advanced Techniques: Add custom trace attributes (e.g., transaction value, cache performance) and use AI tools to detect hidden patterns.
Quick Tip: To maximize tracing efficiency, ensure consistent instrumentation, proper sampling, and robust error handling. This will save time diagnosing issues and improve system performance.
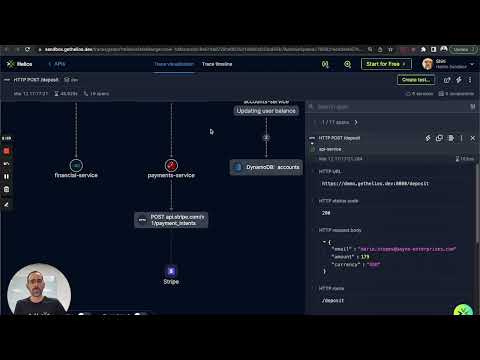
Video: Identifying bottlenecks in your app flows by leveraging OpenTelemetry and distributed tracing
Sometimes it’s easier to see someone investigate and debug in action, rather than having the process explained to you. Here’s a video I found from Helios that showcases the concept well:
Getting Started with Distributed Tracing
Selecting a Tracing Solution
When picking a distributed tracing tool, look for one that works well with your current infrastructure. Here are some popular options:
| Solution | Key Features | Best For |
|---|---|---|
| Jaeger | Open-source, scalable, supports multiple storage backends | Large-scale distributed systems |
| Zipkin | Lightweight, easy to set up, REST API support | Small to medium applications |
| OpenTelemetry | Vendor-neutral, supports many languages, standardized APIs | Cross-platform environments |
Think about factors like how long you need to keep data, sampling features, and visualization tools. We personally support OpenTelemetry for flexibility.
Adding Trace Code
Once you’ve chosen a tracing solution, the next step is to add trace instrumentation to your application. Focus on key areas where performance monitoring is essential. Pinpoint critical parts of your app, such as high-traffic routes or sections that often experience bottlenecks.
Setting Sampling Rules
After adding trace code, set up sampling rules to balance performance with data quality. Here are some recommendations:
| Sampling Aspect | Recommendation | Impact |
|---|---|---|
| Base Rate | 5–10% for high-volume services | Keeps performance steady while collecting useful data |
| Error Traces | 100% sampling for errors | Ensures all issues are captured |
| Critical Paths | Higher sampling for key workflows | Focuses on monitoring essential transactions |
Adjust these rules based on your needs. For example, if you’re troubleshooting a specific service, you might temporarily increase its sampling rate while keeping other rates lower.
Finding Bottlenecks in Trace Data
Reading Trace Graphs
Trace graphs visually map out how requests move through your distributed system. To spot bottlenecks, keep an eye on these key indicators:
| Indicator | What to Look For | Action Required |
|---|---|---|
| Span Duration | Operations taking longer than 100ms | Check for caching opportunities or optimize |
| Error Spans | Red highlights or error flags | Review error logs and refine exception handling |
| Service Dependencies | Multiple calls to the same service | Explore consolidating or optimizing services |
| Parallel Operations | Sequential calls that could overlap | Shift to asynchronous processing |
Pay close attention to spans that take significantly longer than similar operations. For instance, if most database queries finish in 20ms but one consistently takes 200ms, it’s worth investigating. Pair trace data with system metrics to uncover the root cause of these delays.
Combining Traces with System Data
To fully understand performance issues, align trace data with key system metrics. This helps determine whether slowdowns stem from inefficient code or resource limitations.
Monitor these system metrics alongside your traces:
- CPU Usage: High CPU activity during specific spans may indicate compute-heavy tasks.
- Memory Consumption: Sudden spikes might point to memory leaks or inefficient data handling.
- Network Metrics: High latency or throughput issues could explain sluggish service communication.
- Disk I/O: Heavy disk operations can slow down otherwise efficient code.
Overlaying trace data and system metrics on a shared timeline can highlight patterns and correlations, making it easier to pinpoint problem areas.
Locating Problem Areas
Use these steps to identify and resolve bottlenecks:
1. Identify High-Impact Services
Focus on services that regularly cause delays or show high latency.
2. Analyze Dependencies
Examine how these services interact with others:
- Check if slowdowns consistently follow specific service calls.
- Look for circular dependencies that could lead to cascading delays.
- Identify services that might benefit from caching or using connection pools.
3. Document and Prioritize
Organize issues based on:
- Impact on user experience
- How often they occur
- Resource usage
- Importance to business operations
For example, if a payment service consistently takes 3 seconds to process, break it down further by adding spans for steps like validation, processing, and confirmation. This granular data will help you focus your optimization efforts.
Advanced Bottleneck Detection
Data Analysis Methods
Take a structured approach to analyzing trace data to pinpoint hidden performance issues:
- Track high-percentile response times to spot delays.
- Examine call frequencies and error rates to uncover problematic interactions.
- Keep an eye on CPU, memory, and I/O usage trends to identify resource constraints.
- Compare traffic volume and payload sizes to find triggers for performance dips.
Set baseline performance metrics to distinguish normal variations from actual bottlenecks. You can also improve your trace data by adding custom attributes for better insights.
Custom Trace Attributes
Adding custom attributes can provide extra context to your trace data, such as:
- Business context: Include details like transaction value, user tiers, or feature flags.
- Technical metadata: Add information on cache performance or query complexity.
- Environmental factors: Capture aspects like region or deployment version.
This added context can make it easier to detect issues, especially when combined with AI tools designed to analyze such enriched data.
AI-Powered Detection
AI tools can process your trace data to uncover intermittent bottlenecks. These tools can:
- Spot unusual patterns and predict issues before they affect users.
- Identify correlations between performance problems across different services.
To get the most out of AI detection, ensure your trace data is complete, with synchronized timestamps and consistent tagging. Train AI models using historical data and known bottleneck patterns. Set up dynamic thresholds to create smarter, more responsive alerts.
Tools and Tips for Tracing
Key Success Factors
To get the most out of distributed tracing, focus on clear sampling strategies and consistent instrumentation across all your services. This ensures you capture complete and actionable trace data.
Keep an eye on these key metrics to evaluate your trace quality:
- Trace completion rates: Aim for over 95%.
- Instrumentation coverage: Ensure all services are included.
- Sampling rates: Tailor these based on service type.
- Data retention periods: Set appropriate time frames for trace storage.
Also, standardize naming conventions and tagging across your services to make trace correlation easier.
Common Mistakes to Avoid
To maintain strong tracing performance, steer clear of these pitfalls:
- Inconsistent Sampling: Apply the same sampling rules across all services to avoid gaps.
- Poor Context Propagation: Ensure trace context passes smoothly across service boundaries to prevent incomplete data.
- Excessive Data Capture: Focus on capturing only the data you need to avoid slowing down analysis and wasting storage.
- Weak Error Handling: Build robust error management and context propagation to keep trace integrity intact during failures.
Conclusion
Key Takeaways
Distributed tracing plays a crucial role in identifying and fixing performance issues, leading to better system efficiency and reliability.
Here’s what it brings to the table:
- Pinpointing Issues: Helps engineers locate bottlenecks in microservices, cutting down debugging time.
- Informed Decisions: Merges trace data with system metrics to provide actionable insights for optimization.
- Preventive Monitoring: Advanced tools, including AI, detect potential problems early, minimizing user impact.
Use these insights to refine and improve your tracing approach. If you’re obsessed with API performance, then you need a high-performance API gateway with native OpenTelemetry tracing support - AKA you need Zuplo.