Zuplo Changelog
We release improvements, new features, and fixes daily. Follow along here to see the most important updates.
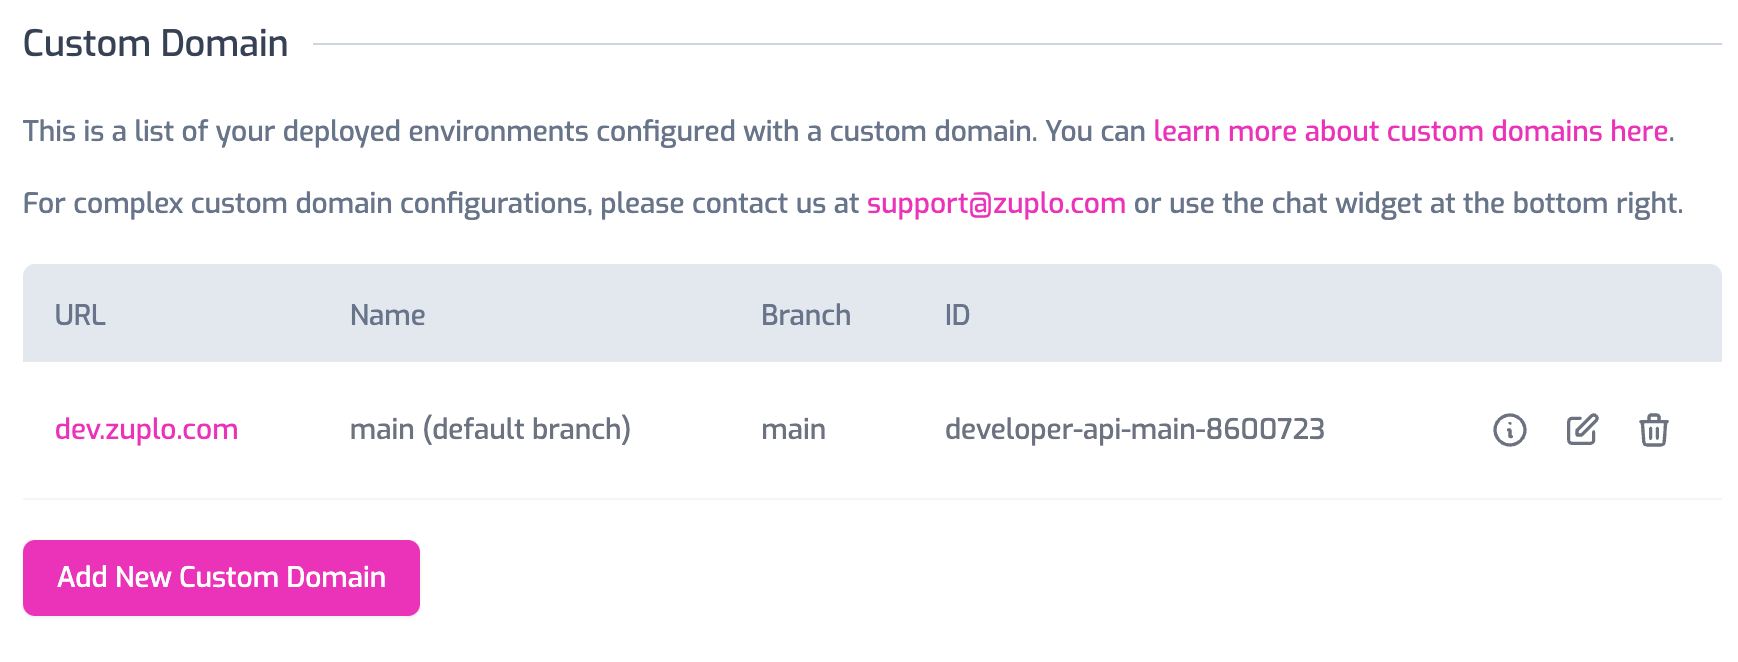
Custom Domains#
Custom Domains can now be fully managed from the Zuplo Portal on all accounts types that support custom domains.
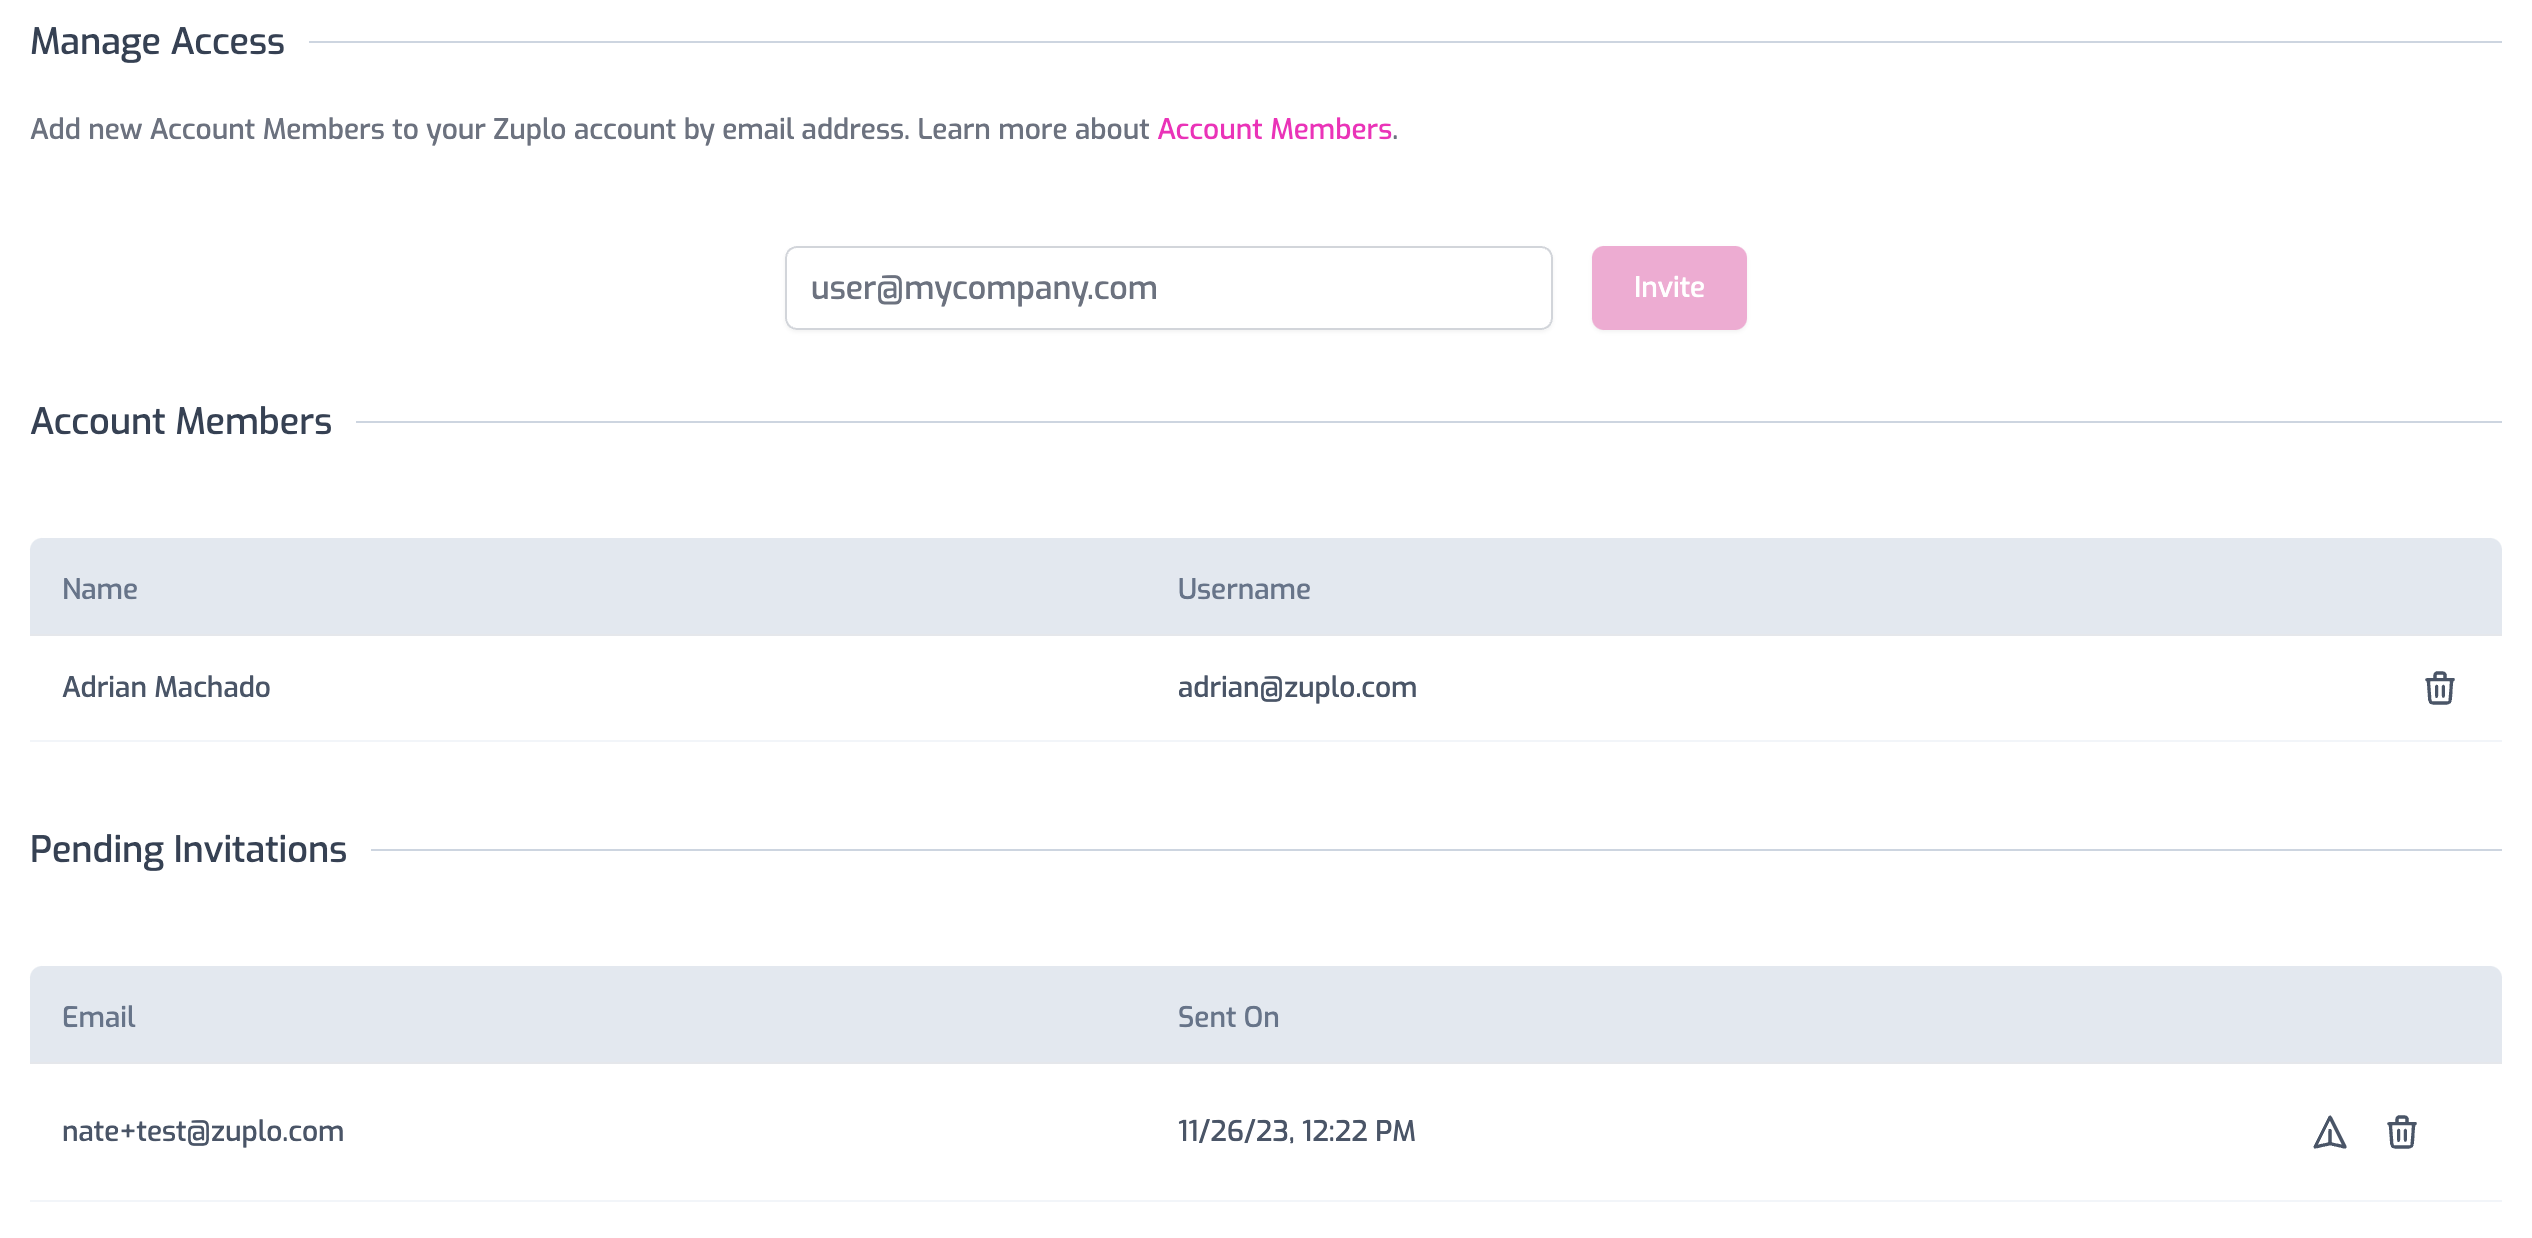
Account + Project Users#
All aspects of managing account and project members can be performed from the developer portal. Additionally, you can now see who has been invited, but not yet accepted their invitations.
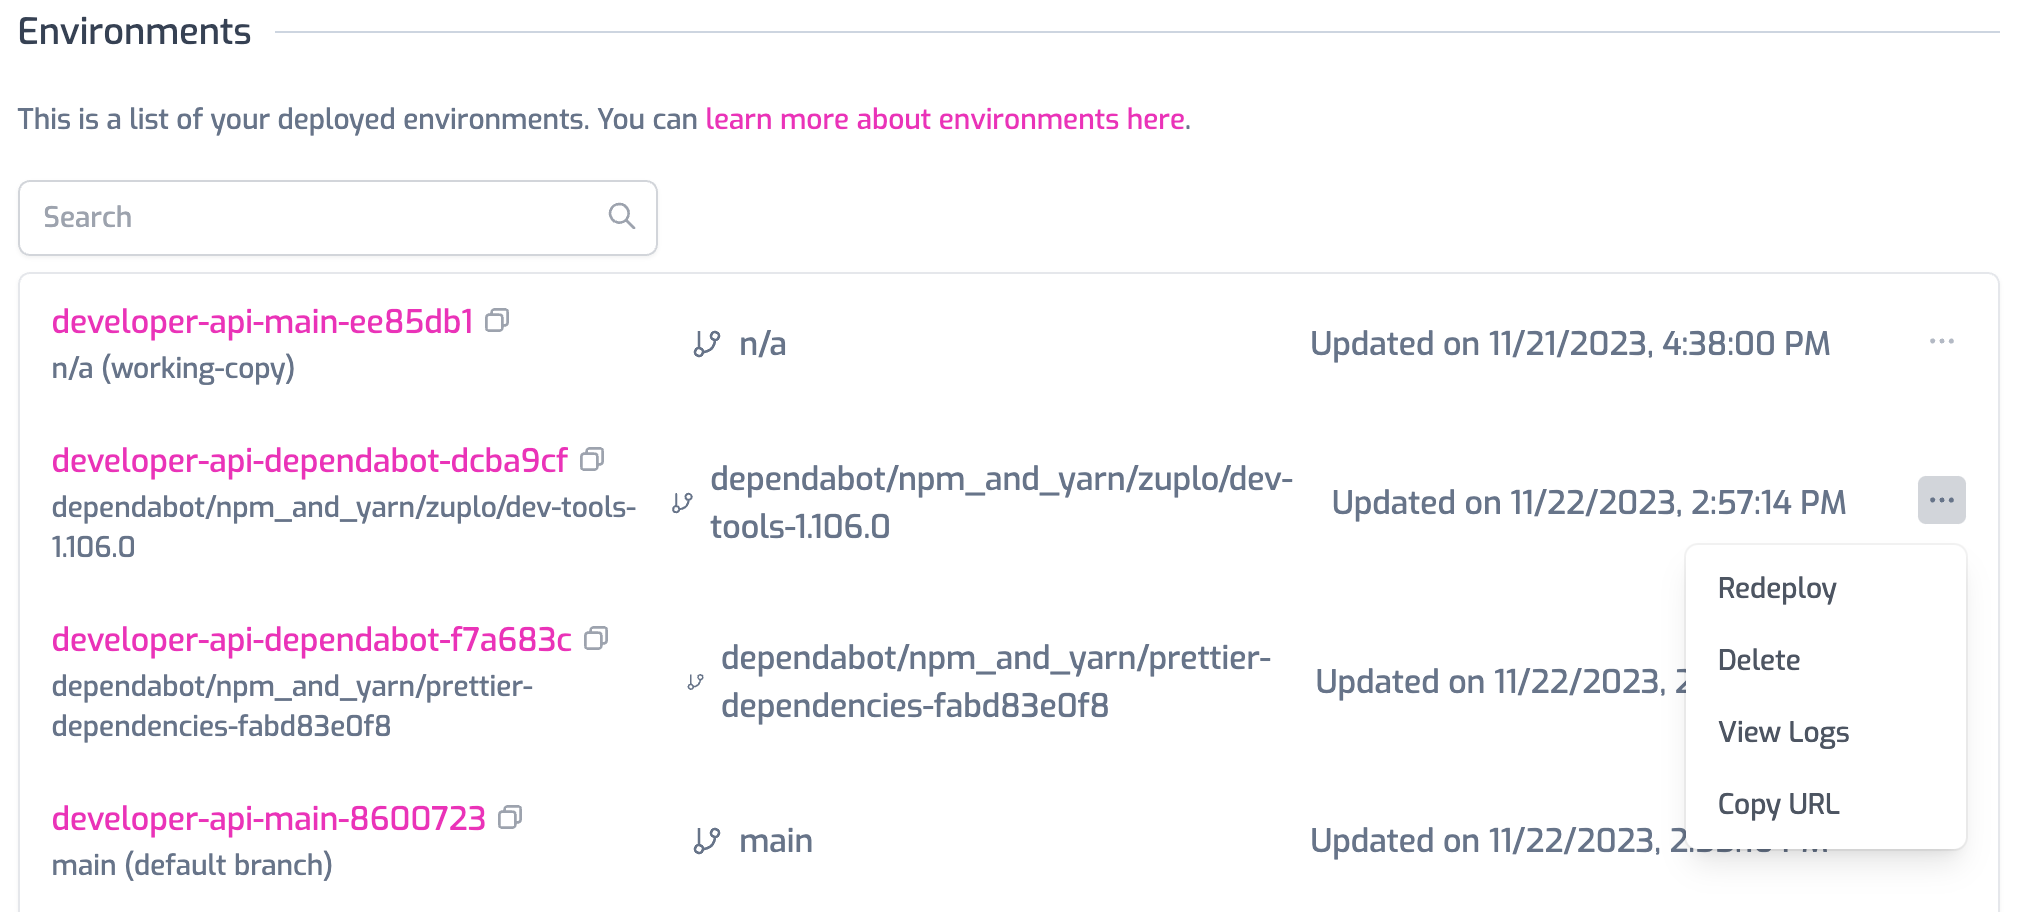
Environment Management#
Environments can now be redeployed or deleted through the Zuplo Portal. Redeploying is useful when you want to change the environment variables without editing code of a source-driven environment.
Logging plugins now include several new fields to help filter logs for different environment types:
The names of these fields may differ depending on your logger as we follow the
conventions of each log service. So environmentType may be environmentType,
environment_type, or environment-type.
environment: This is the name of your Zuplo environment. This will be the same as your Zuplo subdomain. i.e. if your Zuplo URL ishttps://silver-lemming-main-b0cef33.zuplo.app, the environment issilver-lemming-main-b0cef33environmentType: This indicates where your environment is running. Possible values are:edge: Environments deployed to our 300+ edge locationsworking-copy: Environments deployed to your single-instance dev serverlocal: When running with Zuplo local development
environmentStage: This indicates the deployment stage of your environment. Possible values are:production: Environments deployed from your default git branchpreview: Environments deployed from any other git branchworking-copy: Environments deployed to your single-instance dev serverlocal: When running with Zuplo local development
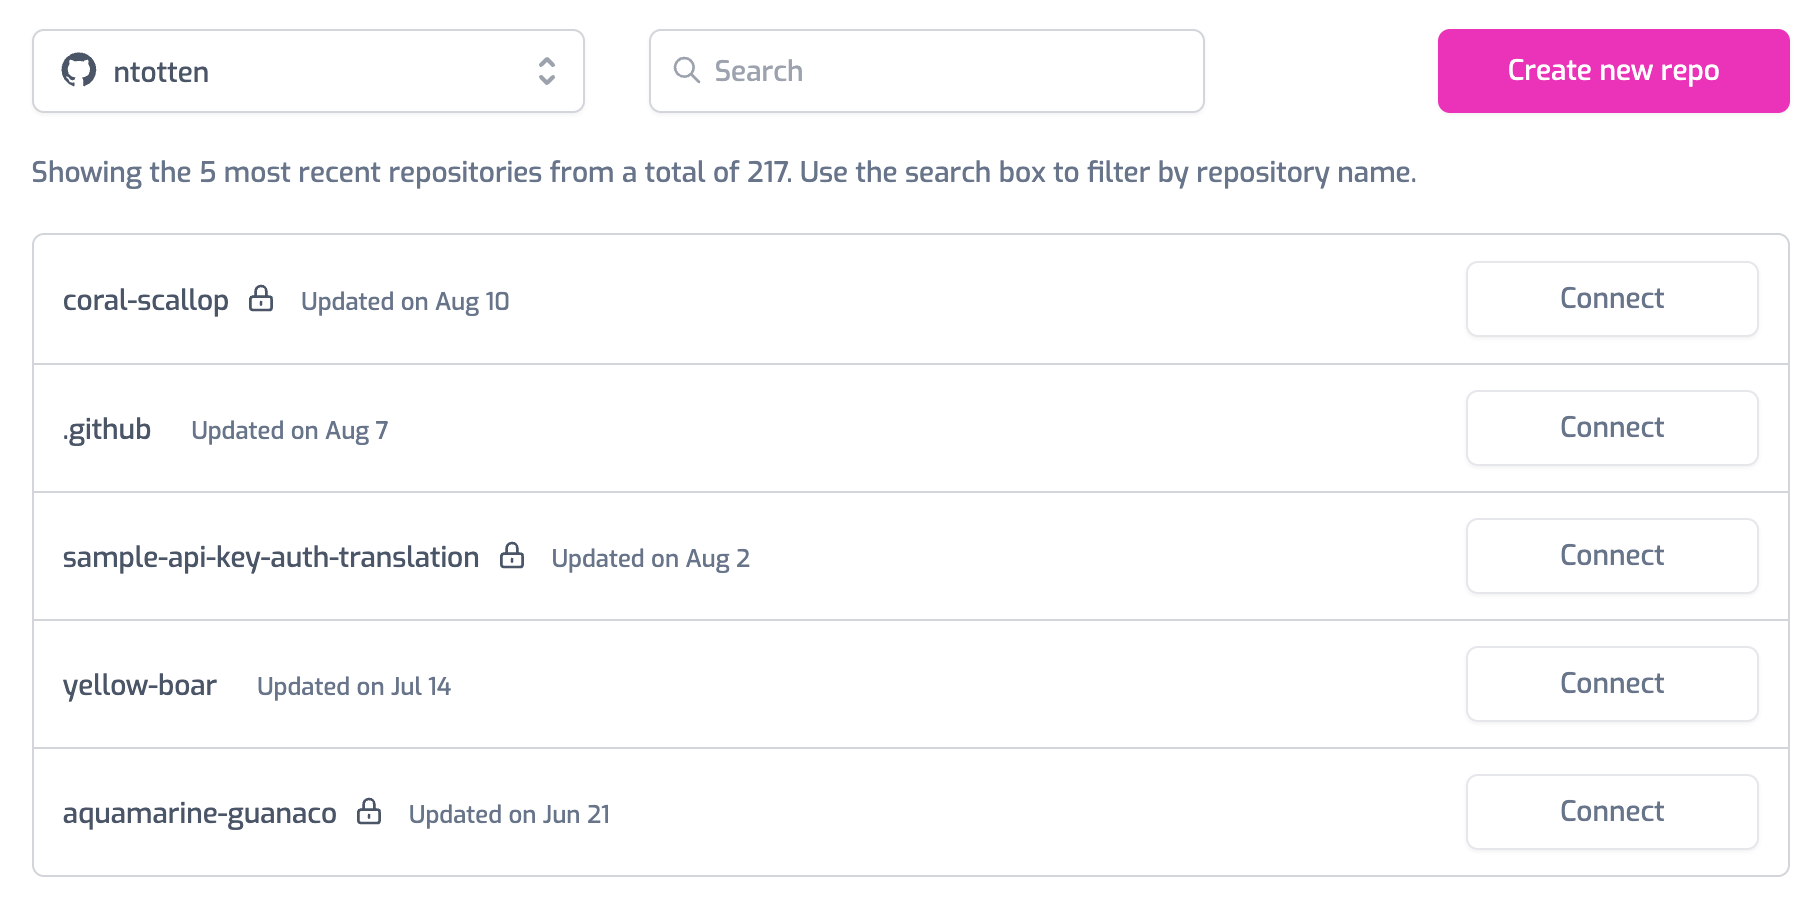
The Zuplo Github integration has been reworked to improve reliability and performance. You can now connect to Github with scoped authentication that allows you to only grant Zuplo access to a single repository. Multiple Github Orgs and Repos can be connected.
See the documentation for details
Enterprise customers can now access rich analytics through the Analytics tab in the dashboard. Analytics make it easy to view:
- Requests by response status
- Top Users
- Users who hit rate limits
- Request latency