A year ago, “API traffic” meant a frontend, a mobile app, or a partner integration. Today, a meaningful share of requests hitting your endpoints comes from AI agents: ChatGPT browsing on a user’s behalf, Cursor making tool calls during a code edit, Claude.ai resolving a citation, a Claude Code session reading your reference docs at 3am.
Most analytics dashboards lump that traffic in with everything else. Latency goes up, error rates wobble, 4xx spikes, and you can’t tell whether it’s your homepage, your SDK, or an LLM hammering an endpoint that was never designed for it.
The new Agents section in Zuplo Analytics breaks that traffic out: a dedicated view of classified AI agent traffic with per-agent volume, error rates, and latency. You can answer “who’s calling my API, and how well is it working for them?” in seconds.
- Teams running APIs that AI tools call: public APIs, MCP servers, developer-facing endpoints
- Anyone whose docs site or reference content gets crawled by agents like GPTBot, ChatGPT, or Claude
- Product and platform owners who want AI adoption as a real metric, not a guess
What Agents analytics shows
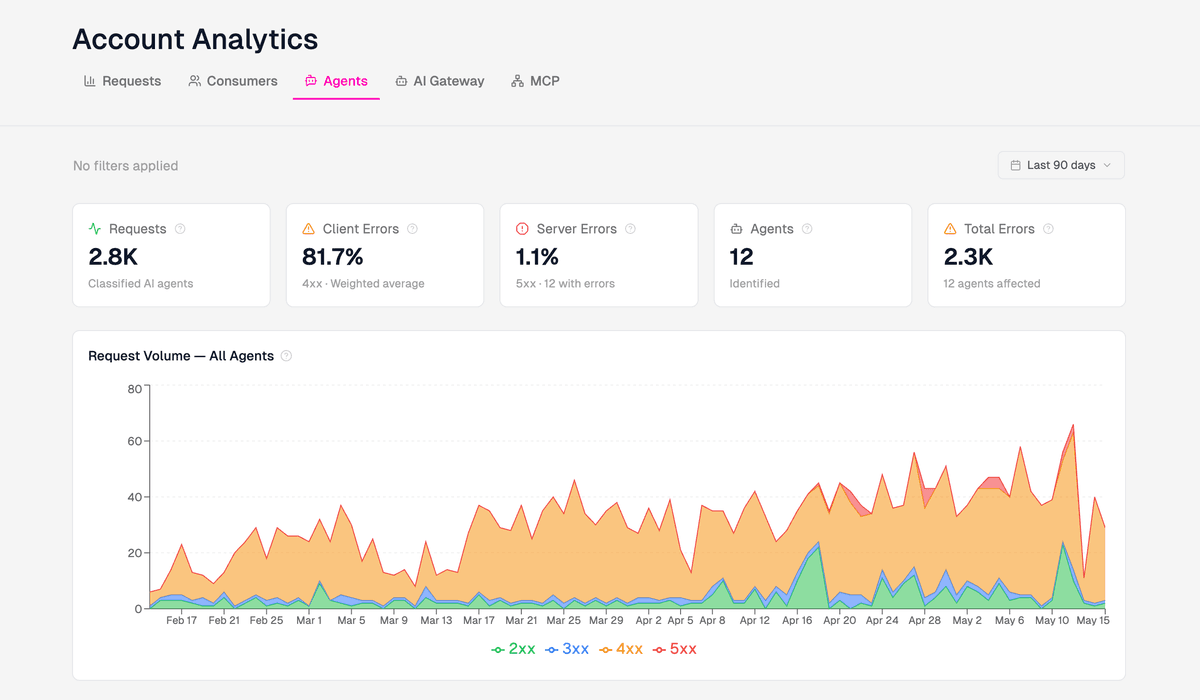
Open Analytics on any project (or roll up to the account level) and you’ll find a new Agents section alongside Requests, Consumers, AI Gateway, and MCP. It has three layers:
Summary KPIs at a glance. Five cards across the top show total requests from classified agents, weighted 4xx and 5xx error rates across that traffic, the number of distinct agents detected, and a combined error count. These are agent-only numbers: browser sessions, webhooks, and generic SDK traffic are excluded so the signal stays clean.
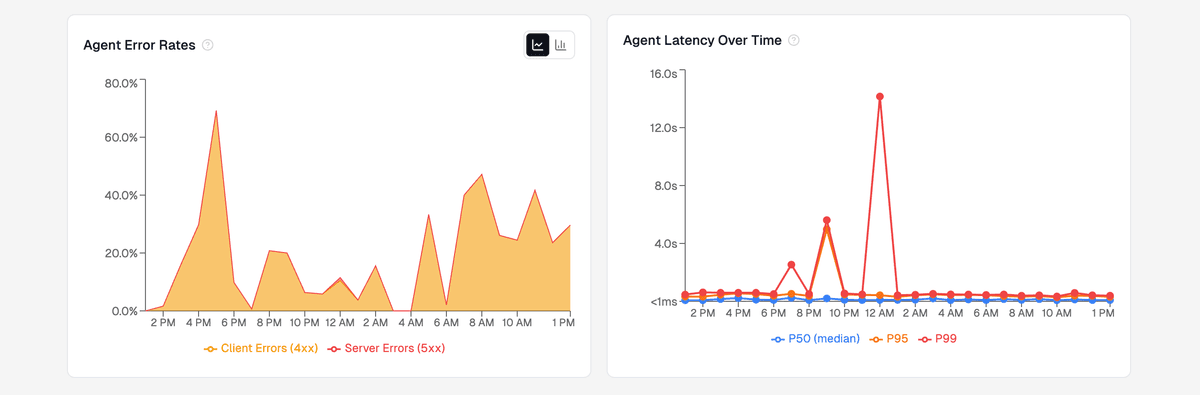
Time-series charts. Three charts plot request volume by status code, 4xx/5xx error rates, and P50 / P95 / P99 latency over the selected window. Hourly granularity, with the same time range controls as the rest of analytics.
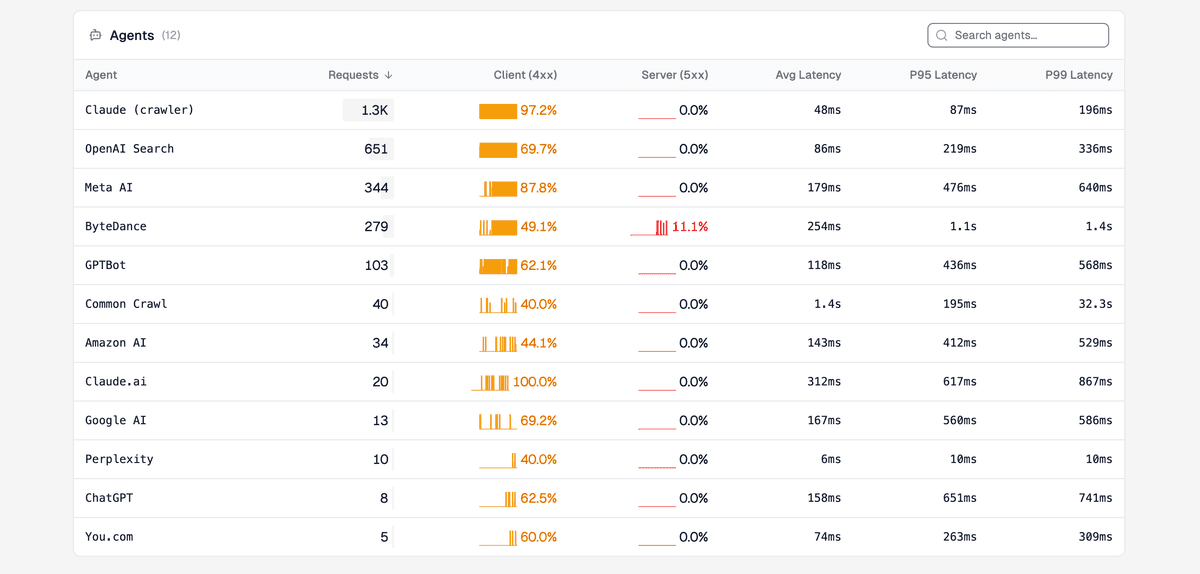
A per-agent table. Every classified agent in your traffic shows up as a row: ChatGPT, Claude.ai, the Claude crawler, OpenAI Search, GPTBot, Meta AI, ByteDance, Amazon AI, Google AI, Perplexity, Common Crawl, You.com, and more.
Each row carries total requests (with a proportional volume bar), 4xx and 5xx rates, average / P95 / P99 latency, and inline 24-hour sparklines. Click any agent name to filter the entire view down to just that agent.
Why this matters
Once agent traffic is its own dimension, a few things become possible:
- Debug agent-specific regressions. If Cursor starts failing 12% of calls while ChatGPT sits at 2%, that’s almost certainly a payload, header, or timeout issue specific to how one tool calls you, not a platform-wide outage. The Agents table makes that obvious in one screen.
- Spot the latency tail that only agents see. Some agents retry aggressively, some fan out, some stream. Per-agent P95 and P99 reveal tail behavior that an account-wide average hides.
- Track AI adoption of your product as a real metric. “How many distinct agents called us last month, and which ones are growing?” is now a chart, not a guess. Useful for product reviews, partnership conversations, and roadmap calls.
- Plan capacity for AI-shaped traffic. Agent traffic doesn’t follow human diurnal patterns. Seeing it isolated by hour helps you size rate limits and origin capacity for workloads that look nothing like your dashboard users.
How it works under the hood
Classification runs server-side on every request, primarily off the User-Agent string plus a few heuristics for tools that don’t identify themselves cleanly.
Matched events are written into a dedicated agent-aware rollup with hourly granularity, distinct from the main request stream. That separation is deliberate: the per-agent charts and KPIs are computed directly from agent-classified events, not by slicing the broader request stream after the fact, which keeps the numbers accurate as volume scales.
Unclassified traffic (browsers, monitoring tools, generic HTTP clients) is excluded so the view reflects AI usage, not noise.
The section ships as part of Advanced Analytics. Enterprise plans can add it on. Free and Builder plans see an Unlock Advanced API Analytics screen with a Try Demo button: the demo loads sample data so you can walk the full layout end-to-end, with a banner pointing to sales when you’re ready to enable it on your real traffic.
Open the Agents analytics
Open any project in the Zuplo Portal, head to Observability → Analytics, and select Agents. If you’ve shipped anything an AI tool might touch (docs, an MCP server, a public API, a developer-facing endpoint), there’s a good chance you’ll find familiar names waiting in the table.
We’d love to hear what you find. The patterns across customers, which agents grow fastest, which endpoints attract the most automated traffic, how error profiles differ across tools, are some of the most interesting data we’ve looked at in a while. Tell us what stands out in yours.