OpenTelemetry Tracing Views
The Observability section of the Zuplo Portal now includes OpenTelemetry tracing views. Every request through your gateway is captured as a waterfall of spans, covering inbound and outbound policies, the handler, and any subrequests, so you can see exactly where time is spent and where errors originate. Traces are stored in Zuplo with no collector or external backend to run.
- Span waterfalls: Each request renders as a timeline of spans across its full lifecycle
- Policy and upstream timing: See how much time is spent in policies versus the upstream call
- No infrastructure to run: Tracing is built into the gateway, with optional export to your own backend
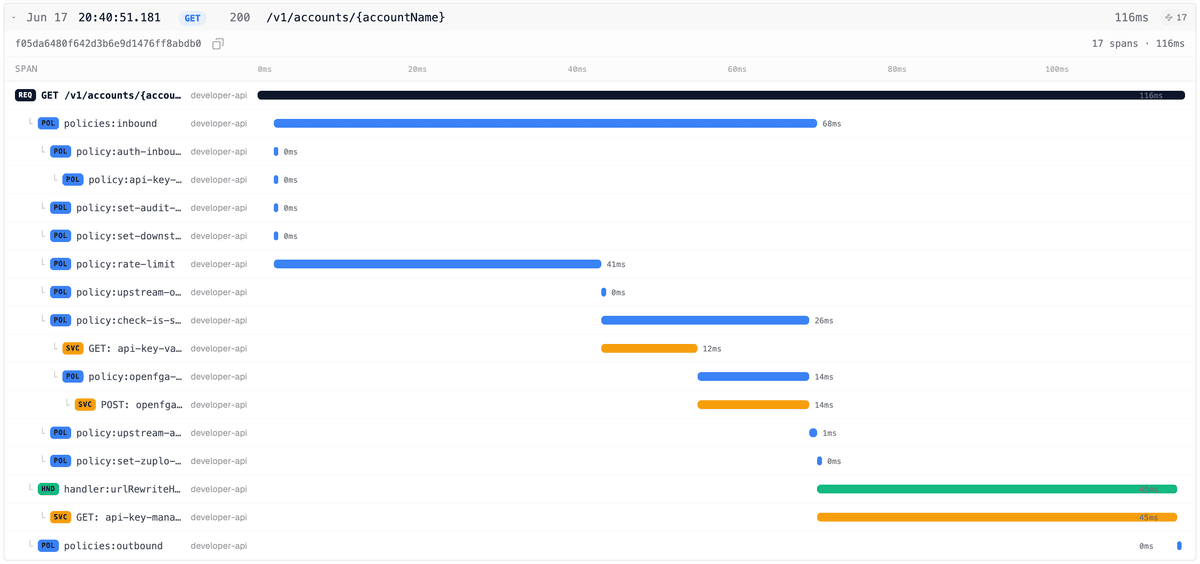
Span waterfalls
Open the Observability section of the Zuplo Portal and drill into a request to
see its trace as a waterfall. The @zuplo/otel plugin instruments the request
lifecycle automatically: inbound and outbound policies, the handler, fetch
subrequests, and Cache API operations each become a span with its own latency,
status, and attributes.
Correlated logs
Logs emitted with context.log carry the request’s zp-rid identifier, so you
can jump between a log line and the trace it belongs to. Logs export in
OpenTelemetry format alongside spans, with any custom properties you set.
Export to your own backend
Tracing writes to Zuplo by default, and you can fan out to third-party backends at the same time. The plugin speaks OTLP over JSON, so Honeycomb, Dynatrace, Jaeger, Middleware, and any OTLP-compatible service work as destinations. Head sampling lets you control trace volume, and span processors let you transform spans before they leave the gateway.
Turning it on
Add the plugin in your runtime extensions to start capturing traces:
Traces reach Zuplo from deployed environments. Local zuplo dev runs skip the
Zuplo destination.
Getting started
See the OpenTelemetry documentation for configuration, custom instrumentation, sampling, and the full list of supported exporters.
Tracing views are an Enterprise feature. To enable them on your project, email sales@zuplo.com.